How To Clean Your Data: A Beginner’s Guide
Learn essential data cleaning steps to improve data quality and analysis. Discover how to handle duplicates, outliers, and inconsistencies.

.png)
.avif)
Data preparation is crucial in big data analysis and processing because datasets often contain various errors, like outliers, inconsistent column names, and duplicate rows. Using dirty data poses the risk of having bias or inaccuracies after analysis. You can avoid this by cleaning the data.
Data cleaning, also called data cleansing or scrubbing, is the process of identifying incomplete, incorrect, or duplicate records and correcting or deleting them in your dataset. Purging errors from your dataset can improve your data quality and ensure an accurate data analysis, which is crucial for effective decision-making, especially for managers and C-suite executives.
The data cleaning process involves several steps, each tackling various types of errors in the dataset. This article walks you through six effective techniques to prepare your data for analysis and help you make informed decisions.
Why you should clean up data
Before we dive into the specific steps of data cleaning, it’s crucial to understand why this process is important in the world of data analytics and data management.
- Accurate data for informed decisions. Clean data is the foundation of accurate analysis. When working with clean data, you can trust that your insights are based on reality, not on errors or inconsistencies. This is especially crucial for businesses making strategic decisions based on data analysis.
- Improved model performance. The quality of your data directly impacts the performance of your machine learning models. Clean data can improve the accuracy and reliability of machine learning algorithms, leading to more effective predictive models and meaningful insights.
- Efficiency in analysis. Working with clean data streamlines the analysis process. Data scientists and analysts can spend more time extracting insights and less time dealing with data inconsistencies, missing values, or errors.
- Enhanced data integration. When combining data from multiple sources, clean and consistent data formatted data makes the data integration process much smoother. This is particularly important for large organizations dealing with data from various departments or external sources.
- Scalability. As your data grows, the impact of dirty data compounds. Establishing good data cleaning practices early on makes it easier to scale your data operations as your organization grows.
- Real-world applicability. Clean data bridges the gap between raw information and actionable insights. It ensures that your analysis reflects real-world conditions as accurately as possible.
1. Remove duplicate and incomplete cases
Duplicate errors describe situations where you have repeated entries in a dataset. Such entries can artificially inflate the dataset’s size, making it more difficult to work with.
On the other hand, incomplete data are missing one or more important values. For example, it’s common for some respondents to skip certain questions when they fill out surveys, meaning some fields of your data will be blank. Another situation where you might see incomplete cases is when working with data that has been collected over time. In this case, you might have certain periods with some missing values or null values.
Having either duplicate entries or inconsistent data in your dataset can cause problems with your data analysis. They can introduce bias to your conclusion, which may lead to faulty business decisions. To tackle such errors, you’ll want to identify and remove the duplicate and incomplete entries in the dataset.
Identify and remove duplicate data
We have a sample dataset containing fields that define a sample population’s name, gender, region, and annual salary. For this tutorial, we’ll use Microsoft Excel for data scrubbing.
- To start, launch Microsoft Excel and load the dataset. Go to File and select Open. Choose the file’s location and select Open to load the dataset onto your workspace.
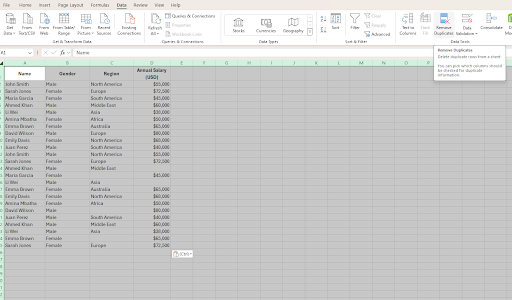
- Next, highlight all the rows and columns in your table and select the Data tab at the top of the page.
- Next, go to Remove Duplicate.
4. You’ll notice that Excel recognizes the list of columns. Check the boxes next to the column names to select the list of columns you want to change.

5. Then, select OK to delete duplicates.

Identify and remove incomplete cases in datasets
After deduplication, you can move on to identify and remove empty rows and cells.
1. Highlight the entire table and go to the Home tab at the top of the screen. Click Find & Select and Go to Special.

2. At this point, a window will appear on your screen. Select Blanks and click OK.

3. Now, you’ll notice that all the empty cells are highlighted. Right-click on one of the empty cells and select Delete. Repeat this process until the empty cells are removed.

Now, you’ll have a dataset without blank spaces. However, you may approach this step a little differently depending on your interest in the dataset. For example, missing data in the “name” and “region” columns may not bother you if you’re not focusing your analysis data on each respondent.
Instead of selecting the entire table, you might select a single column and follow the above steps to remove the blank spaces or carry out data imputation (manually adding realistic estimated data values).
2. Remove oversamples
Consider this scenario: You send out a survey to analyze the annual income of people in a population. After the results return, you get a total response from 650 entries (350 who identify as male and another 300 who identify as female). In data science, we call that imbalanced data because one group has more representation than the other.
To create balanced data, you may have to randomly remove 50 male entries, bringing the total of each set to 300. The image below shows a similar scenario, but with a smaller dataset.

Here, we have five males and two females represented in the dataset. We can randomly remove three male entries to create equal representation by right-clicking on a row and selecting Delete.
3. Ensure answers are formatted correctly
In data science, we often gather input from multiple data sources, like surveys and questionnaires. It’s common to see structural errors where people present similar answers in different data formats. Data transformation is crucial to ensure consistency across your dataset.
For example, some people may write phone numbers using the format (999) 999 9999, while others may use dashes in the format (999) 999-9999. Or you may have varying spellings when referring to the same things, like writing “December” as “Dec.” Neglecting these errors will cause the algorithm to interpret such entries as separate, introducing errors to the analysis.
Raw data may include nonsensical answers, incorrect capitalization, typos, and illegible data. For instance, characters like hashtags or question marks are unnecessary in the field. Whichever format structural errors appear in, these steps will help you eliminate them from your database.
1. To start, select the column you want to edit. Go to the Home tab at the top-left corner of the screen, then select Sort & Filter. Next, select Filter and click OK.

2. At this point, a filter button will appear beside the header of the column you want to edit. When you click on the filter icon, a window showing the list of unique entries in each column will appear. Note that you’ll want to make sure you don’t have any merged cells to complete the filtering steps.

3. Select the inconsistent entries and click OK. At this point, only the rows with inconsistent entries will appear on the spreadsheet. You can now manually correct each entry.

4. After correcting all the errors in the column, click the Filter button in the heading cell, choose Select All, and press OK. You can repeat this process for other columns to ensure all data entries are consistent with the format in the column.

4. Identify and review outliers
An outlier is a data point that is significantly different from the rest of the data. Data collection errors and natural data variations can cause outliers. Identifying outliers in a dataset before performing any statistical analysis is important, as they can skew the results.
There are several methods for identifying outliers in a dataset. One common method is to calculate the interquartile range (the range of values in the middle) of the data and identify any data points that are more than two standard deviations away from the mean.
Another method is to create a graphical visualization with box plots or the data points on a graph and look for any points that are far away from the rest of the data.

We'll show you how to use the interquartile range method in the steps below.
Step 1. Name columns for each calculation parameter
To begin, create a column for outliers, first quartile, third quartile, interquartile range, lower boundary, and upper boundary.

Step 2. Calculate the first quartile
For the first quartile, type =QUARTILE(.
Now, select the entire Annual Salary column (D in the example below). At this point, the quartile formula will display the range of cells (in this case, cells D2 to D16) you’re analyzing for an outlier.
Next, we’ll continue typing the formula for the Q1 column. Enter a comma (,) and select the first quartile. Press the Enter button on your computer to apply the formula and generate the value of the first quartile (Q1).
In this case, your formula will look like =QUARTILE(D2,D15).

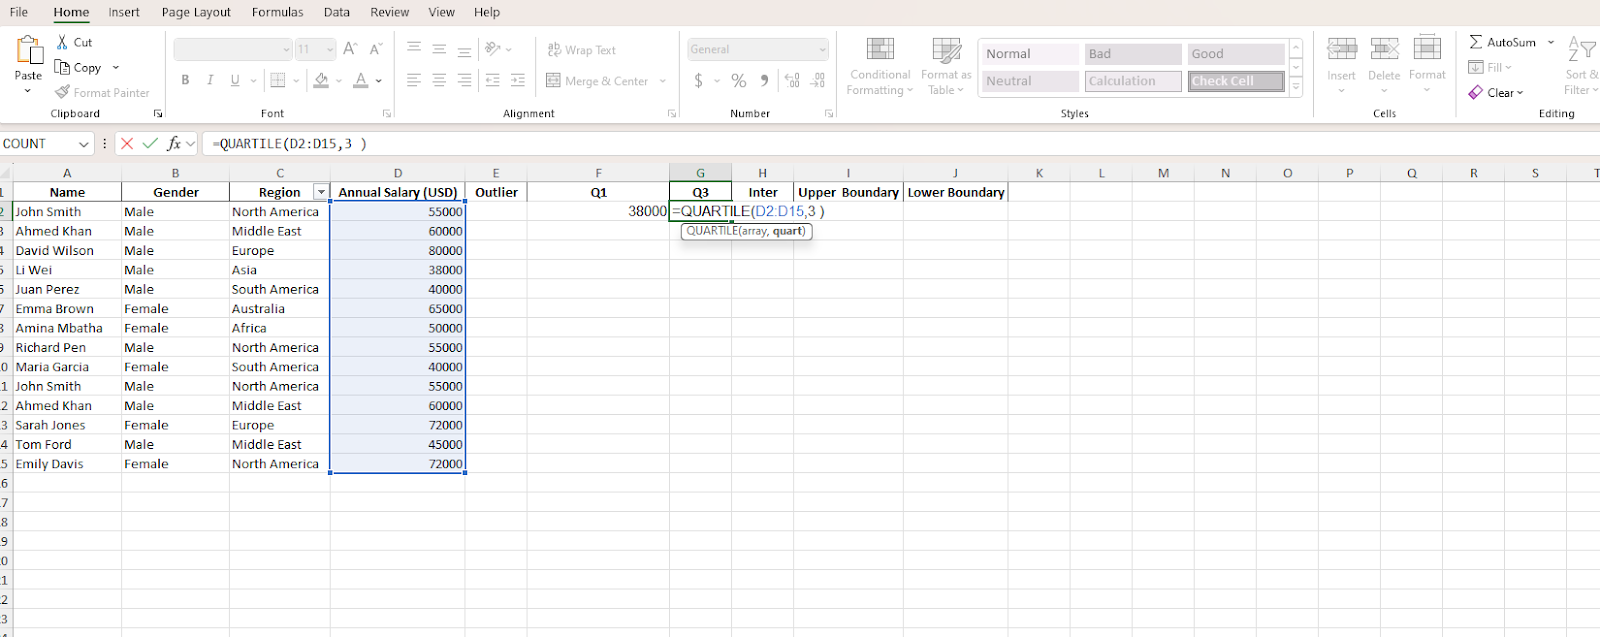
Step 3. Calculate the third quartile and interquartile range
Under the Q3 column, type =QUARTILE(.
Then, highlight the column analyzing Annual Salary. At this point, the quartile formula will display the range of cells you’re analyzing for an outlier.
Next, type a comma (,) and select the third quartile. Now, click Enter. You’ll see the formula =QUARTILE(D2,D15,3).
To calculate the interquartile range, you’ll subtract the first quartile from the third quartile. That is Q3-Q1. To input the formula to your interquartile column, type =(G2-F2) in cell I2.
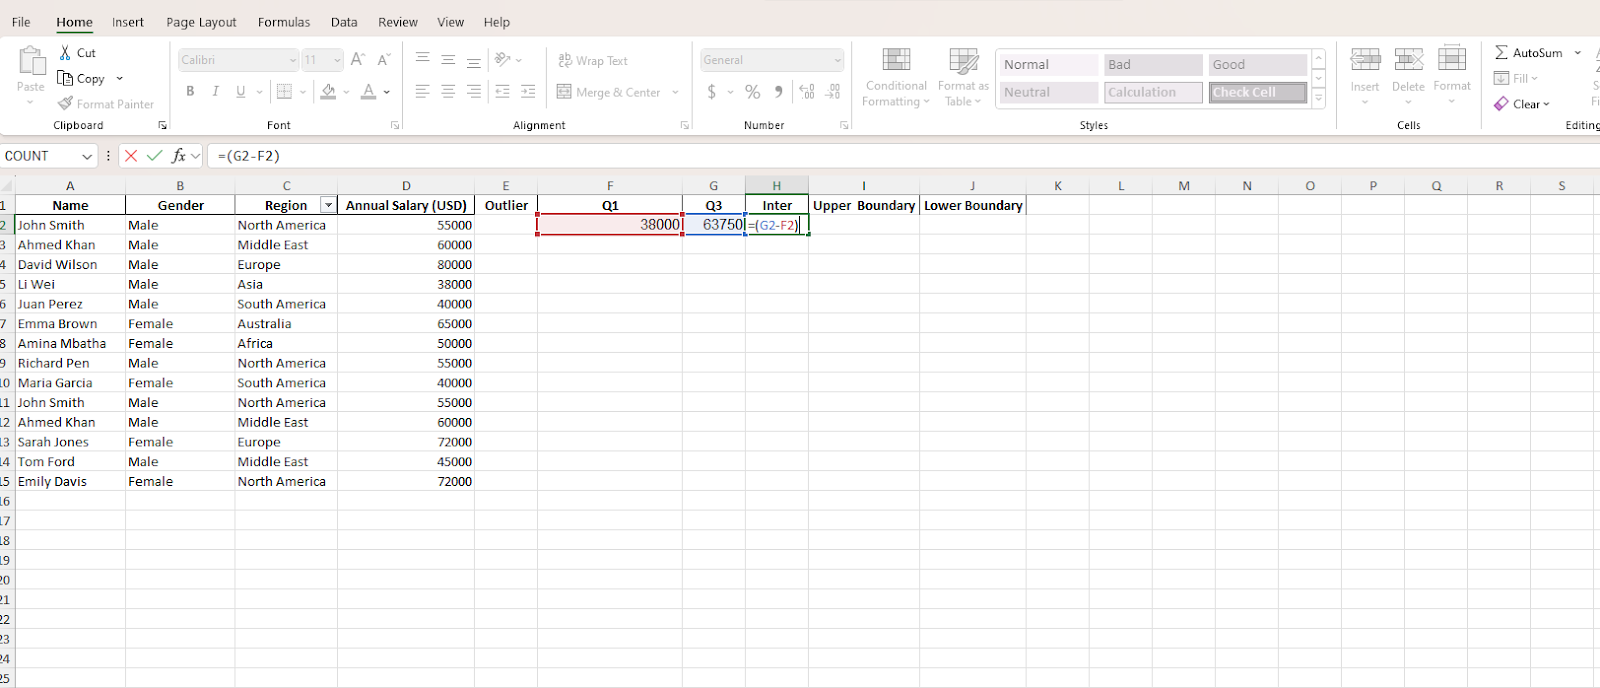
G2 represents the cell name where we put the third quartile formula. F2 is the tag for the cell where we generated the first quartile value. Next, press the Enter button to apply the formula and generate the value for the interquartile range.
Step 4. Calculate the upper boundary
At this point, we'll calculate the value of the upper and lower boundaries. The formula for the upper boundary is:
Upper boundary = Third Quartile + (1.5 × Interquartile range)
Since we have calculated the value for the third quartile and interquartile range, we'll represent their values with their cell number. In this, we’ll write the following formula:
=G2+(1.5*H2)
G2 represents the cell where we generated the third quartile value, while H2 is the cell for the interquartile range. Next, press Enter.

Step 5. Calculate the lower boundary
The statistical formula for the lower boundary is:
Lower boundary = First Quartile - (1.5 × Interquartile range)
As with the upper boundary, we’ll represent the value of the first quartile and interquartile range with their cell numbers. So, we’ll have the following:
=F2-(1.5*H2)

Press Enter to display the result of the calculation.
Step 6. Determine the outlier
Now that we’ve derived all parameters for determining an outlier, we can determine which of the salary entries is an outlier. The trick is to compare each entry with the upper and lower boundaries. Values that fall outside of these boundaries are considered outliers.
We will first compare the value of our first entry to the upper and lower boundaries to determine if it’s an outlier. To achieve that, we’ll employ the =or function. The function evaluates arguments and determines reports TRUE or FALSE, depending on the validity of the value. In this case, values that are outliers will be flagged TRUE.
Type =OR(D2>I2,D2<J2) under the Outlier column of the first entry (Row 2 in the example below).
- D2 represents the data value in the Annual Salary column in row 2
- I2 represents the cell containing the upper boundary value
- J2 represents the cell containing the lower boundary value
The statement, D2>I2, tells the Excel algorithms to determine if the D2 value is higher than the upper boundary. On the other hand, D2<J2 evaluates if the E2 value is lower than the lower boundary. Values greater than J2 and lower than I2 are considered outliers.

After typing the formula, press Enter to run it and determine whether the value (the annual salary) is an outlier. For our first entry, the result came out TRUE, meaning the value is an outlier.

Apply the formula to the rest of the entries on the column by dragging down the highlighter in the outlier column.
At this point, you can filter the outliers to delete or manually correct them.
5. Code open-ended data
At some point, you’ve likely filled out a form with open-ended questions where you have the freedom to express your ideas or concerns. Common cases where such fields appear are in customer complaints, feedback, or event registration forms. This type of text data requires special handling in your data cleaning workflow.
To analyze such types of data, you’ll need to standardize the entries into definite values you can analyze. Here are some steps you can take to classify open-ended data:
Analyze the entries.
People typically analyze open-ended data in two ways. One way is to read through each entry manually. This way, you can analyze the intent of the respondent and categorize the entry accordingly.
If you’re analyzing large datasets, running through each entry manually can be challenging. As a result, people also leverage natural language processing (NLP) models—like Bidirectional Encoder Representations from Transformers (BERT) or Robustly Optimized BERT Pretraining Approach (RoBERTa)—to automate the process of determining the respondent’s intent and categorize the data accordingly.
Create relevant categories.
As you analyze each entry and identify the respondent’s intent, you can classify varied categorical data and tag each entry with a matching category. For instance, if you're analyzing a customer complaints form for a bank, you can create categories like “deposit,” “mobile transfer,” or “mortgage” based on the subject of the complaints.
To achieve this, create a new column next to the column containing the entries. Highlight the column with the open-ended data and right-click to select insert 1 column right.
The new column will contain the categories of each entry. You can name the column whatever you want, but we named ours Location. Use these new standardized values to analyze the data.

Next, read through all the entries and classify them into various categories.
6. Check for data consistency
Checking for consistency is an important data validation step in filtering out bad data. It ensures high-quality data for proper analysis.
Running a data consistency check requires that you critically observe the modified or cleaned dataset and compare it with the original entries. The goal is to ensure there are no contradictions between the original entries and the refined data. If you notice any inconsistencies, you may correct the error manually or remove the affected row from the dataset.
Further, you may choose to cross-confirm outliers to ensure they’re genuine entries. In the case where the respondent is a direct contact or customer, you can contact the person to confirm the details. If you purchased data from another business, you can decide to remove outliers and other questionable entries.
At this stage, you can pass the dataset to a data team composed of professionals like data analysts and scientists to further cross-check the data for errors.
Let a data cleaning analyst be your guide
We worked with smaller datasets for the sake of this tutorial. However, you may have to work with larger datasets comprising various customers’ data—numbering hundreds to thousands of entries.
Analyzing such data volumes can be complex and time-consuming and require advanced data cleaning tools like OpenRefine and Trifacta Wrangler. In such situations, you can use the Upwork Talent Marketplace™ to find expert help.
Upwork allows clients to post their projects and get bids from professionals interested in working on them. Once you receive interest in your data cleaning project, review profiles and hire a data cleaning professional. If you’re a data analyst or data scientist, you can also visit Upwork to connect with prospective clients and land a project assignment.
Upwork is not affiliated with and does not sponsor or endorse any of the tools or services discussed in this article. These tools and services are provided only as potential options, and each reader and company should take the time needed to adequately analyze and determine the tools or services that would best fit their specific needs and situation.

.avif)

Author Spotlight

Upwork is the world’s largest human and AI-powered work marketplace that connects businesses with independent talent from across the globe. We serve everyone from one-person startups to large organizations with a powerful, trust-driven platform that enables companies and talent to work together in new ways that unlock their potential.