8 Essential Data Mining Techniques for Your Business
Data mining reveals comprehensive business information using advanced modeling and analysis techniques. Here, find the most-used techniques you should know.

.png)
.avif)
The amount of data available to businesses today is unprecedented and at such a scale that making sense of it can be tough. If not addressed effectively, this challenge can reduce both the value of big data and your ability to make informed decisions.
Fortunately, data mining offers a solution.
Data mining is the process through which organizations identify patterns in data to gain business-relevant insights. Data mining is critical for business intelligence and data science, and businesses might employ several data mining techniques to transform raw data into meaningful insights.
Data mining techniques range from the latest artificial intelligence models to the fundamentals of data cleaning, which are critical for optimizing the return on data investments.
For businesses looking to harness the full potential of data, here are eight essential types of data mining techniques to explore.
1. Correlation analysis
Correlation analysis is among the most popular data mining applications for calculating the correlation of two variables by measuring the degree of their linear relationship. This type of data analytics figures out how much one variable has changed because of how the other variable has changed. The higher the correlation between two variables, the stronger the suggested association.
Why is correlation analysis essential?
This type of data analysis can uncover significant associations between several measurements or groups of variables between old and new data sets. Even if the data comes from different business sectors, information about those relationships might provide helpful insights and indicate inter-dependency.
Correlation analysis methods

Correlation analysis use cases
Marketing experts use correlation analysis to assess the effectiveness of a campaign by monitoring and evaluating customers' reactions to various marketing approaches. Using correlation analysis allows them to appreciate and better serve their customers.
2. Classification
Classification is a data mining process that requires you to collect a wide range of attributes into discernable categories, which you can apply for further analysis. Depending on the financial background and purchase history of an individual customer, you may classify them as "low," "medium," or "high." These classifications can help to further understand customers.
Techniques of data mining classification
- Logistic regression. This algorithm determines the likelihood of a specific outcome within two possibilities. A spam-detecting email service, for instance, can use logistic regression analysis to make predictions about emails.
- Decision trees. A decision tree is a decision-making tool that uses a tree-like model of decisions and their potential outcomes, such as random event outcomes, overhead charges, and utility. Decision trees offer one method of displaying an algorithm with only conditional control terms.
- K-nearest neighbors. This algorithm tries to identify an unknown object by comparing it to others.
- Naive Bayes. Naive Bayes classifiers are a group of simple “probabilistic classifiers” that use Bayes’ theorem and make strong (naive) assumptions about how independent the features are from each other.
- Support Vector Machines (SVMs). Support Vector Machines (SVMs) are machine learning algorithms that assess data for regression and classification. An SVM can help classify images and is used in facial and handwriting recognition software.
Classification use cases
Financial firms categorize consumers depending on factors like earning brackets and monthly expenditure to promote new loans or estimate credit card risks. Meanwhile, weather applications categorize data to forecast snowfall totals and other related information.
3. Outlier detection
Unlike other data mining techniques which look for hidden patterns and trends, outlier identification seeks something unique: the characteristics of a data point that stand out compared to the rest or depart from the sample as a whole.
Outlier identification identifies inaccuracies, such as data that was improperly entered or pulled from the incorrect sample. Raw data variations can often provide useful information.
Techniques for detecting outliers
Outliers in numbers are identified using the interquartile range or the median of values. An outlier is a set of data that doesn't fit into that range.
- Z-score. The Z-score indicates how far a data point deviates from the sample mean. Extreme value analysis is another name for this technique.
- DBSCAN. This method, which stands for "density-based spatial clustering of applications with noise," identifies data as core points, boundary points, and noise points, which are outliers.
- Isolation forest. Using an algorithm that looks for anomalies rather than profiling specific data points, this technique separates abnormalities in massive data sets (the forest).
Outlier detection use cases
Outlier detection is typically used to improve logistics, foster a culture of preventative damage control, and uphold an atmosphere that is more pleasant for clients, users, and other influential groups.
4. Clustering
Clustering analysis is the practice of grouping complex data elements based on their shared properties. Data miners can then split aspects of big data into subsets, making better educated decisions about broad populations (like consumers or users) and their corresponding habits.
Data clustering methods
Using the partitioning approach, you can divide data sets into several distinct clusters for analysis, following the standards of each cluster. In this strategy, each data point belongs to a single cluster or group.
The hierarchical technique treats data points as a single cluster categorized based on commonalities. Afterward, these newly formed clusters can be studied in isolation.
- Density-based method. A machine learning technique in which data points plotted together are investigated further, while data points plotted alone are deemed "noise" and eliminated.
- Grid-based technique. This method divides different types of data into grid cells, which may be grouped by individual cells instead of processing large databases all at once. Consequently, grid-based clustering processes data quickly.
- Model-based approach. This approach finds the best data to fit each data cluster by building models for it.
Clustering use cases
Clustering assists firms in better managing their data. Retailers, for example, might use these statistical models to discover when, how often, and by whom a specific product is bought. Clustering can assist retailers in targeting items and services to clients in a particular demographic or location.
5. Sequential patterning
Sequential Patterning is a data mining approach that looks for statistically meaningful patterns between data sets where the values come in a specific order.
What you are doing when you use sequence patterns is:
- Finding patterns that occur frequently
- Comparing sequences
- Finding missing parts of a sequence
- Creating useful indexes for sequence data
Sequence patterning methods
There are two different data mining tools under sequence pattern mining:
- String mining. When dealing with text mining in a series, this subset of sequence pattern mining comes into play. The data warehouse may only contain a specific number of characters. For instance, a DNA sequence only comprises the letters A, T, C, and G; consequently, its analysis falls under string mining. String mining is also used to find patterns in strings of ASCII characters.
- Itemset mining. This is a more comprehensive subset of sequence pattern mining that searches for ordered patterns in sets of data. Most of the time, sales and marketing applications use itemset mining to help increase co-purchases of items frequently bought together, cross-promote products, manage inventory, set price levels, and so on.
Sequence pattern use cases
Sequence pattern mining can be instrumental during data warehousing and in many fields, including business and the sciences. Specific examples include:
- Figuring out relationships in things people buy
- Understanding the significance investors place on patterns in financial markets
- Examining proteins and DNA sequences in computational biology
- Using website logs to figure out what a user does online
- Predicting natural disasters by looking at how they have happened in the past
- Studying how people use their phones
6. Data visualization
Data can be displayed visually using charts, graphs, maps, infographics, and other tools. Data visualization is one of the main approaches used to illustrate information in data science.
Methods for visualizing data
There are several ways to display data visually, including:
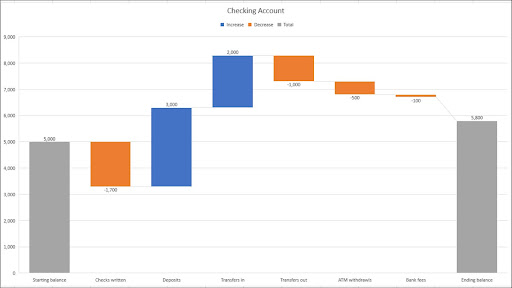
- Comparison charts. Data can be represented visually in graphs and tables, such as a year’s worth of transactions in a checking account.
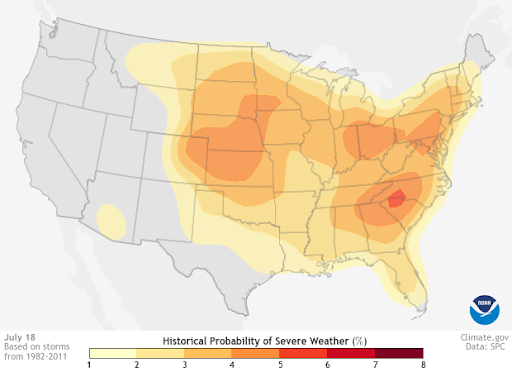
- Maps. The purpose of data maps is to depict geographic-specific data. Data can be visualized on maps to demonstrate population density and variations, compare populations of surrounding states, counties, and nations, determine how people are distributed throughout geographical regions, and contrast one region’s features with those of other areas.

- Temperature maps. This widely used data representation method illustrates patterns and ranges in the data by employing a variety of color schemes and shading techniques to depict the data. Using it, you can keep tabs on everything from regional temperature shifts to cuisine and pop cultural trends.
- Density plots. These visualizations follow data through a given factor or characteristic, generating what appears to be a mountain range. For example, the diagram below shows the percentage of butterfat in milk produced from four cattle breeds.Image source

- Histograms. These resemble density plots but are displayed as bars on a graph instead of using a linear form.

- Network diagrams. These diagrams explain how data points relate to one another by connecting items with a series of lines (or links).

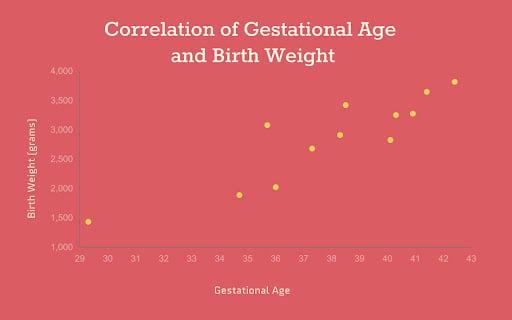
- Scatter plots. These graphs show the relationships between data points along an axis with two independent variables. You can use a scatter plot to compare different things, like the correlation between birth weight and gestation age of women in a given population.
- Word clouds. These images highlight specific instances of a word or phrase within a body of text; the more significant the term’s size in the cloud, the more frequently it appears in the text.

Data visualization use cases
Markets & Markets predicts that, by 2026, the global market for data visualization tools will nearly double in size to $10.2 billion. Businesses improve their decision-making process using simple data to grasp and analyze problems through efficient, aesthetically pleasing media like graphs, 3D models, and even augmented reality.
7. Neural networking
Artificial neural networks use computers to imitate how the human brain works. Neural networks employ many computer processors (similar to how the brain uses neurons) to analyze data, make decisions, and learn in the same manner humans do—or as close as possible.
Neural network methods
Neural networks have three main layers: the input layer, the hidden layer, and the output layer. The input layer receives data, the hidden layer processes it, and the output layer resolves it so that any necessary actions depending on the data can be taken. Depending on how much data is being used and learned, the hidden layer can have many processing layers.
Neural networks use supervised and unsupervised learning algorithms to "teach" themselves to perform in ways comparable to the human brain.
Neural networks use cases
Neural networks can be used for many different things. Businesses might use them to forecast consumer purchasing trends and target particular demographics with marketing campaigns. Additionally, they can assist merchants in understanding how to employ dynamic pricing and predict sales accurately. Also, they help improve ways to diagnose and treat patients, which improves care and performance.
8. Computational advertising
Computational marketing is a new field that helps with marketing strategies using computers and data mining methods. Computation is a method of giving form and function to chunks of information that are too big for any individual to analyze.
When people do things online, they give away information about themselves. All the information you post on social media and your search history reveals your personality and interests. This information is highly sought after by advertisers who wish to understand customer behavior and preferences.
Computational marketing is a way to improve the experience for shoppers by using algorithms, mathematical equations, software programs, and other analytical tools.
Computational advertising techniques
The highly technical field of computational marketing uses many branches of computer science.
- Information retrieval. The Internet includes an enormous amount of data, but accessing the information you need isn’t always easy. Information retrieval aims to strengthen, speed up, and improve user access to the desired information.
- Machine learning. This subfield of artificial intelligence aims to develop methods for machines to identify and respond to intricate patterns. Simply put, it involves instructing robots to learn from their surroundings.
- Website optimization. Not every website functions as designed for every user. Optimization is a process for making a website as easy to use as possible.
- Microeconomics. This is the analysis of how the economy works on a microscopic scale. It looks at how people decide what to buy.
Computational advertising use cases
Companies that are most engaged in computational advertising are big stores and popular websites. Stores want to use this strategy to boost sales and make customers happier. Computational advertising is used by businesses like Walmart and Amazon to match their items to the demands of their customers.
Team up with a data mining specialist
With several data mining techniques available to you, it’s important to find the right professional for your business needs. Upwork makes it easy to browse and engage the best data mining specialists.
Are you a data mining professional looking to help take businesses to the next level? Browse the available data mining freelance jobs on Upwork today.

.avif)

Author Spotlight

Upwork is the world’s largest human and AI-powered work marketplace that connects businesses with independent talent from across the globe. We serve everyone from one-person startups to large organizations with a powerful, trust-driven platform that enables companies and talent to work together in new ways that unlock their potential.