Managing Data Science with V2MOM, Scrum and Cross-functional Squads
.png)
Data Science (DS) has emerged as a discipline that when applied correctly, can have a transformational effect on the ability of an organization to leverage data assets for product innovations. This is especially the case when data scientists have a deep understanding of the business context and adopt a product mindset to solve hard technical problems in the most practical ways, delivering value to end-users and maximizing core business metrics.
At Upwork, we think of the ideal data scientist as a person who combines the best traits of a product manager, researcher, and software engineer. Understanding user pain points and what it takes to improve core business metrics, our ideal data scientists solve hard problems using scientific methods and apply engineering best practices to turn these solutions into high-quality products. Of course, these traits are hard to find in a single individual. And at Upwork’s scale, it always takes a large team to support the full product development cycle — from pain points to new product features. How do we organize and run a data science team that can combine these traits to ship products with high business impact?
At Upwork we found at the start of our journey a research-centric organization that lacks the business context to focus on the right problems and to ship the right products. Through several iterations and improvements at the level of operational execution, team organization and alignment with strategic goals, we found ourselves closer to that ideal notion of a data science team that combines and balances the traits of product strategists, economists, machine learning scientists and software engineers.
In this article, you will find
- how we adopt scrum and agile best practices to improve the efficiency of operational execution,
- how we use V2MoM to set the vision and business context, drive tactical project roadmaps and align operational execution with strategic goals and business metrics,
- and how we restructure our organization to form cross-functional teams that have the autonomy and capacity to support the entire product engineering lifecycle.
Baseline
We start our journey with a DS team that in terms of organization and processes, is a mixture of a research group and an engineering organization.
Team Organization: the DS team is divided into two camps: the Data Scientist Team focuses on developing Machine Learning (ML) models and solution prototypes while the Data Science Engineering Team is responsible for building the data and ML infrastructure and rewriting these prototypes to put them in production.
Planning: a project roadmap is established every quarter, which captures the core projects, owners, outcomes and targeted business impact. It serves as a high-level guideline but is not updated frequently to guide and reflect changes in project execution. There is often a huge gap between planned targets vs. actual outcomes.
Execution: while the team is officially using Jira and relying on a 2-week sprint cycle for task execution, this adoption of the scrum framework varies greatly between teams and team members. The difference is especially large between engineers and data scientists: the latter struggle to think and execute in terms of stories and tasks, and are often reluctant to take the rituals of sprint planning and retrospective seriously.
The limitations and issues of this team setup and processes become more apparent as our team grows from 10 to 30+ team members and our projects gain in complexity. These are the main problems we have identified and solved through a series of organizational and process improvements:
- Support for scrum adoption: While times are allocated for various sprint meetings, there is a lack of process and tool support around it: teams don’t have the rituals to establish a healthy backlog and to identify and work on issues towards continuous improvements. There is no dedicated scrum master to coach team members, reinforce habits and help to cultivate a scrum mindset.
- Performance visibility: There is a lack of data points and metrics the team and individual members can use to understand their performance, and to identify potential for improvements.
- Task estimation, prioritization, and distribution: The guidelines established for all engineering teams are not particularly suited for estimating efforts required for our data science tasks. The lack of data points also does not help team members to leverage their past experiences. As a result, workload estimation was imprecise at best and team members end up with an uneven workload. Furthermore, priority levels are not used or assigned consistently, which makes it even more difficult for team members to focus and to adjust their task commitment as necessary.
- Gap between task planning and execution: We make changes mid-sprint to redistribute the workload but it is not effective to address the problem that team members don’t complete their tasks or complete tasks that are out of scope. Every sprint, there is a considerable gap between work committed and the actual deliveries.
- Predictability of execution: The issues above have a negative impact on our ability to execute and to predict the timeline and outcome of our execution. Having clear commitments and ensuring timely delivery is however very critical to build stakeholder trust and gain the support we need to deliver product innovations with business impact.
- Alignment between task execution, project planning, and business strategies: besides the high-level project roadmap, there are no other tools and rituals in place to effectively guide task planning and make sure task-level progress is aligned towards project completion. Similarly to the situation at the task level, we see plenty of rooms to improve the execution of projects and the predictability of project outcomes. While the core individuals responsible for the project roadmap understand the business strategies and goals, this information is not passed down to set the context for the project owners to make adjustments to the plan, to address project delivery risks and to double down on new opportunities.
- Scaling team organization: besides lacking the context required to be agile in terms of planning, our teams also are not organized to be self-sufficient in their capacity to optimize execution. While our two science and engineering teams have their own meetings and rituals, end-to-end execution of a project requires contributions from both teams. Hence, nearly every project has both an engineer and a data scientist as co-owners. This works for small projects with clear requirements and defined handoffs. But for large projects with high uncertainty, this team setup leads to high communication overhead and enormous friction in the collaboration between the two teams.
In the next sections, you will find the iterations we have gone through to address the issues above towards scaling a data science organization that can deliver product innovations with maximum business impact.
Iteration 1: Improving Operational Execution with Scrum
In this iteration, we adapt the Scrum framework to meet our needs and enforce rituals and guidelines to improve sprint over sprint execution performance.
Adapting Scrum to Manage Operational Uncertainties

The scrum framework and agile best practices have proven to be effective in dealing with business uncertainties. It provides the tools and processes to adjust planning and execution to changes in the business environment and goals.
When applied to software engineering, the result of a scrum iteration is often deployable code that aims to address specific business requirements. To work towards that goal, we plan and execute in sprints, which can be adjusted to accommodate changes in requirements. The main uncertainty is the business requirements, while the technical realization is often well understood (“1-to-n projects”): requirements are easily mapped to stories and tasks, which can be executed with high predictability.
In the data science context, however, we face additional uncertainties in planning and execution. This is because solving data science problems is more like managing 0-to-1 projects, where the path to solution is mostly unknown and the business impact is hard to predict. Instead of managing outcomes, we use scrum practices to manage uncertainties. The output of every sprint is often not deployable code but learnings that can help to reduce uncertainties.
We distinguish the following type of uncertainties and adopt scrum practices as follows to work towards different deliveries:
- Concept: Can we translate business requirements to a technical problem formulation? Is there a known solution that is applicable to our problem? We create Jira issues to address this conceptual uncertainty, which often involve discussions with peers, review of research papers, adopting known solution to our problem, and developing prototypes. Depending on the complexity of the problem, managing this uncertainty might require one or several sprints. Our guideline here is to decompose the problem into subproblems. Then, prioritizing the hardest one first allows us to execute towards the quickest path to reducing uncertainty. The result of a sprint is either a proof of concept or actionable findings that help with the decision to continue, pivot or abort the project.
- Implementation: Given a concept we found to be viable, can we implement it in a way that satisfies our standards for productionization? Managing uncertainty at this level requires exploring whether we have the data for implementation, whether we have a feedback loop in place and collected sufficient training examples for building ML models, and whether our DS infrastructure is equipped with tools and library needed to train and deploy the models. In the end, we need to understand whether, given the scope and project timeline, we will be able to deliver an implementation that satisfies latency, throughput and other requirements of a high-quality software product. Also here, we start with the hardest question first and every sprint should produce findings that help to close the loop, i.e., an implementation plan or a no-go decision.
- Metric: This is arguably the hardest uncertainty to manage. At the same time, it is also the most important one: the best concept/implementation will be of little use if it cannot not deliver improvements to core business metrics. Reducing this uncertainty requires us to always think of the smallest possible unit of code we can ship to get an early assessment of the metric impact. Do need to implement the whole concept and execute the implementation plan in its entirety or is there an end-to-end delivery that is more limited in scope? Also here, the main guideline is to reduce complexity and to package deliveries in small increments. Every iteration should produce deployable code that can be used to quickly test user acceptance and validate our metric impact hypothesis.
In conclusion, we find the Scrum framework and agile best practices useful and discussed tweaks we found necessary to cope with the added levels of uncertainty. We established guidelines for our team members to plan tasks and execute towards different types of deliveries, i.e., actionable learnings vs. concept vs. implementation plan vs. deployable code.
Establish and Enforce Scrum Rituals
We employ a program manager, who also serves as a dedicated scrum master to help facilitate and enforce the scrum adoption.
First, we straighten out the rituals to establish the process shown below. With this, we introduce ordered routine and pace and designate the time boxes needed for our team members to adopt the process and balance their planning and execution.
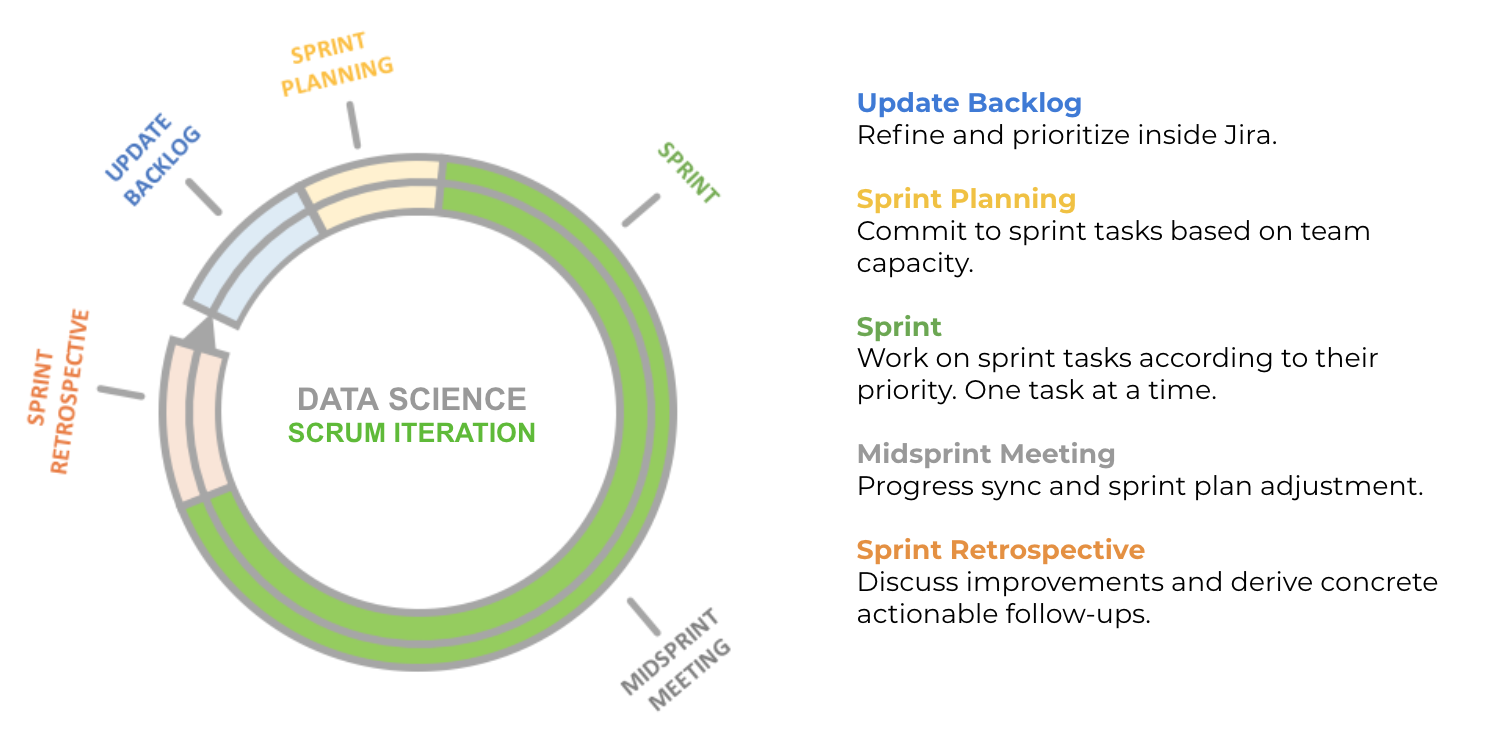
We found that backlog grooming turns out to be different from the traditional scrum practice. Given the high uncertainty, our sprint plan often depends on and is driven by the learnings and outputs delivered in the previous sprint. Rarely, our team finds it effective to have stories and tasks planned for several sprints ahead of time. Instead, we run backlog grooming in between the retrospective and the planning meetings and focus on capturing tasks that are immediately relevant for the next sprint.
The retrospective meeting also plays a special role: with every sprint, we gain valuable learned lessons in how to refine our process and to cope with uncertainties. We share learnings and derive guidelines for task formulation, story point estimation and managing our commitments. We also identify performance issues, gaps between planning and execution and derive concrete actions to be taken for improvements.
We establish guidelines for task estimation and prioritization as shown below. It was especially challenging to help data scientists clearly capture their tasks and improve their effort estimates. While there is a natural reluctance, the idea of breaking down complexity and reducing uncertainty resonates and our team members follow the recommendations to improve the predictability of their delivery, think of different delivery types and plan out smaller chunks of outputs. Tasks that take the entire sprint become rare, most tasks have fewer than 8 story points and team members usually have multiple tasks with different priorities assigned per sprint. While there is often no deployable code, our team members always have tangible outputs and learnings that provide a sense of constant progression.


Data Collection and Reporting
Of course, as a data science team, we see value in data points and invest considerable effort to track performance, generate reports and identify potential for improvements in a systematic fashion.
We introduce the use of the burndown chart and sprint health dashboard as shown below for our two teams to understand their sprint performance, and what adjustment in terms of pace and scope are needed to complete all tasks.


These reports seem rudimentary but prove to be sufficient to show value and to start our journey. You will find more detailed tracking and reporting in iteration 3 when we have a better team setup and the right mechanism to incentivize teams and individual members to improve their performance.
Iteration 1 — Retrospective
In this iteration, we adapted the scrum framework and introduced guidelines that make more sense for our data science teams to apply to their routine and to cope with the added level of uncertainties.
Coupled with more support (tool, personnel) and defined rituals, we saw a greater level of adoption. Coaching, support, and reinforcement was needed for our team members to correctly capture stories, priorities and story points. But that level of scrum support is much reduced after a few months as our team members continuously form habits. As responsibility and performance becomes more visible, we also see a continuous trend towards more even workload.
At least at the level of sprint execution, we see continuous improvements in completion rate (see charts below) and predictability of sprint outcomes.
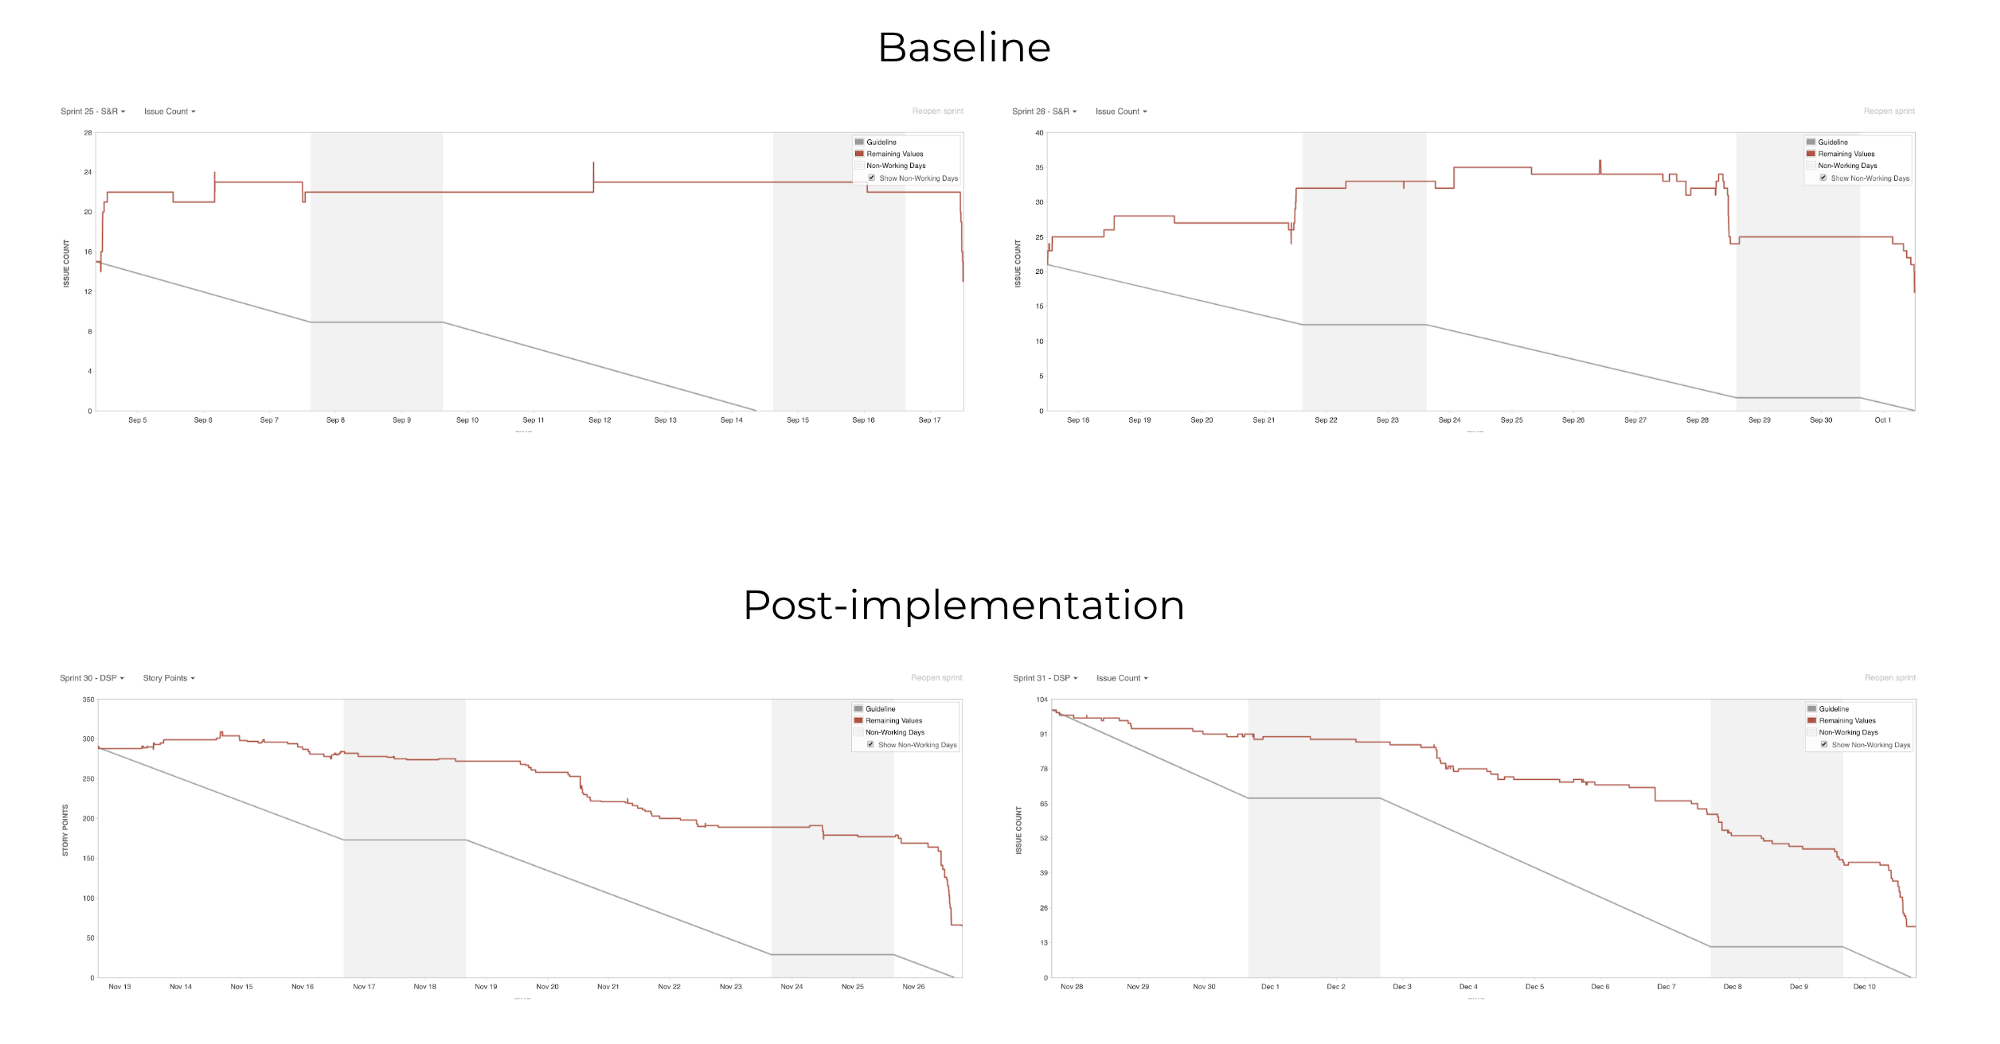
While these are clear signals for improved operational efficiency, we are not confident about “doing the right things” and our ability to deliver business impact. There is still a gap between delivering outputs vs. delivering business impact. Please read on to see how we attempt to solve this in the next iteration.
Iteration 2: Aligning Strategies, Project Plans, and Tasks
We discussed the problem of alignment and now, will introduce a set of ideas and tools we have adopted to solve this.
As shown below, we employ Jira and tracking sheets to track, measure and optimize deliveries across the 3 levels of task execution, tactical project planning, and strategic goals. To avoid “waste” and focusing on the “right things”, we emphasize the role of strategic planning and make sure that business context, strategies, and metric targets are shared and execution are in sync across levels.

Strategic Goal and Context Setting
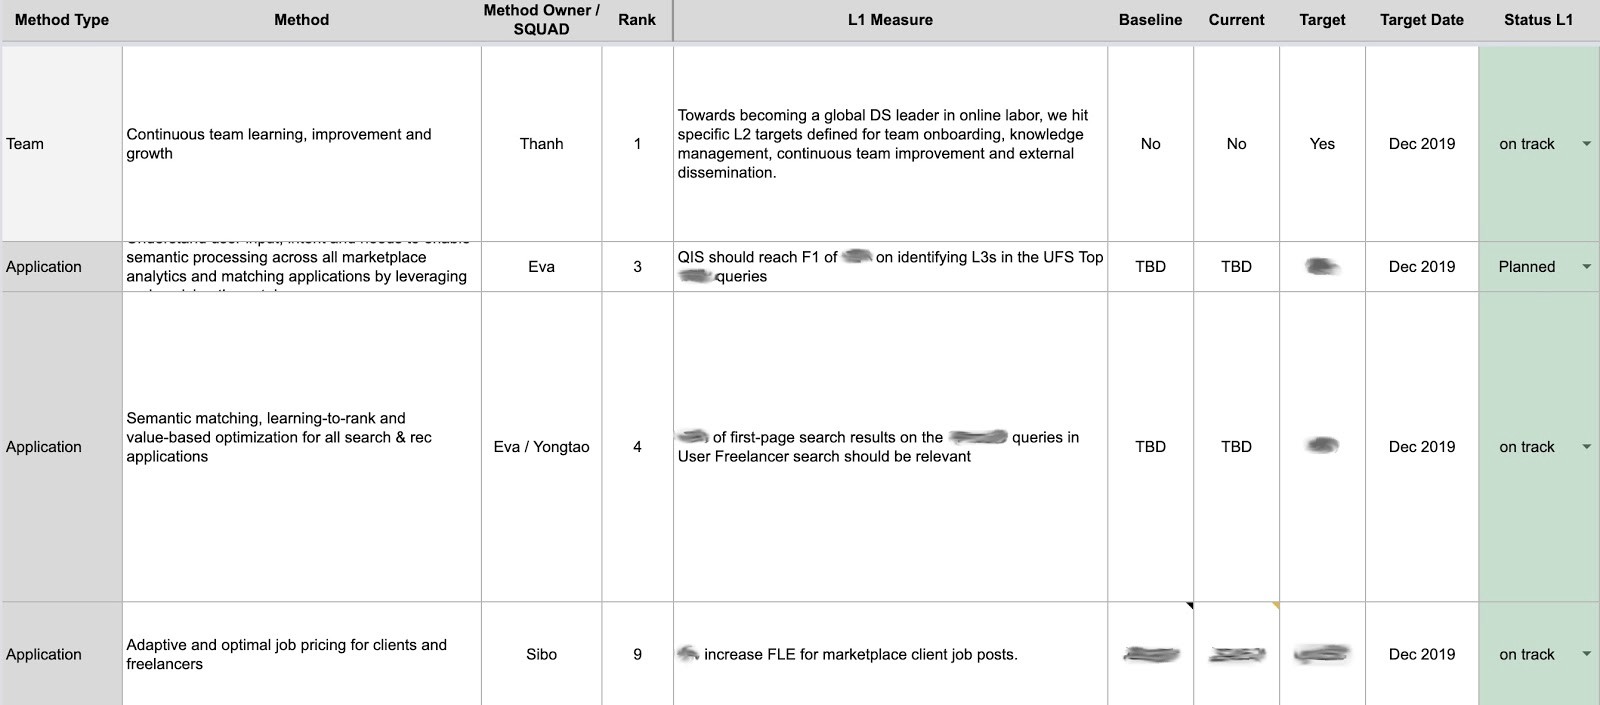
At Upwork, we use V2MOM as a framework to establish and communicate Vision, Values, Methods (think of these as high-level strategies that help guide project planning), Obstacles and Measures.
We use V2MOM to set the context and directions needed for our teams to plan projects and steer execution towards delivering on core metrics and accomplishing our vision. Except for the Measures (metrics), we revise our V2MOMs yearly. While high-level lag metrics are stable, we change lead metrics and rebase targets with new project findings.
We track and measure the execution of our V2MOM as shown in the sheet below: every method has an owner and is linked to a set of metrics, and metric target completion is updated monthly.
Project Planning
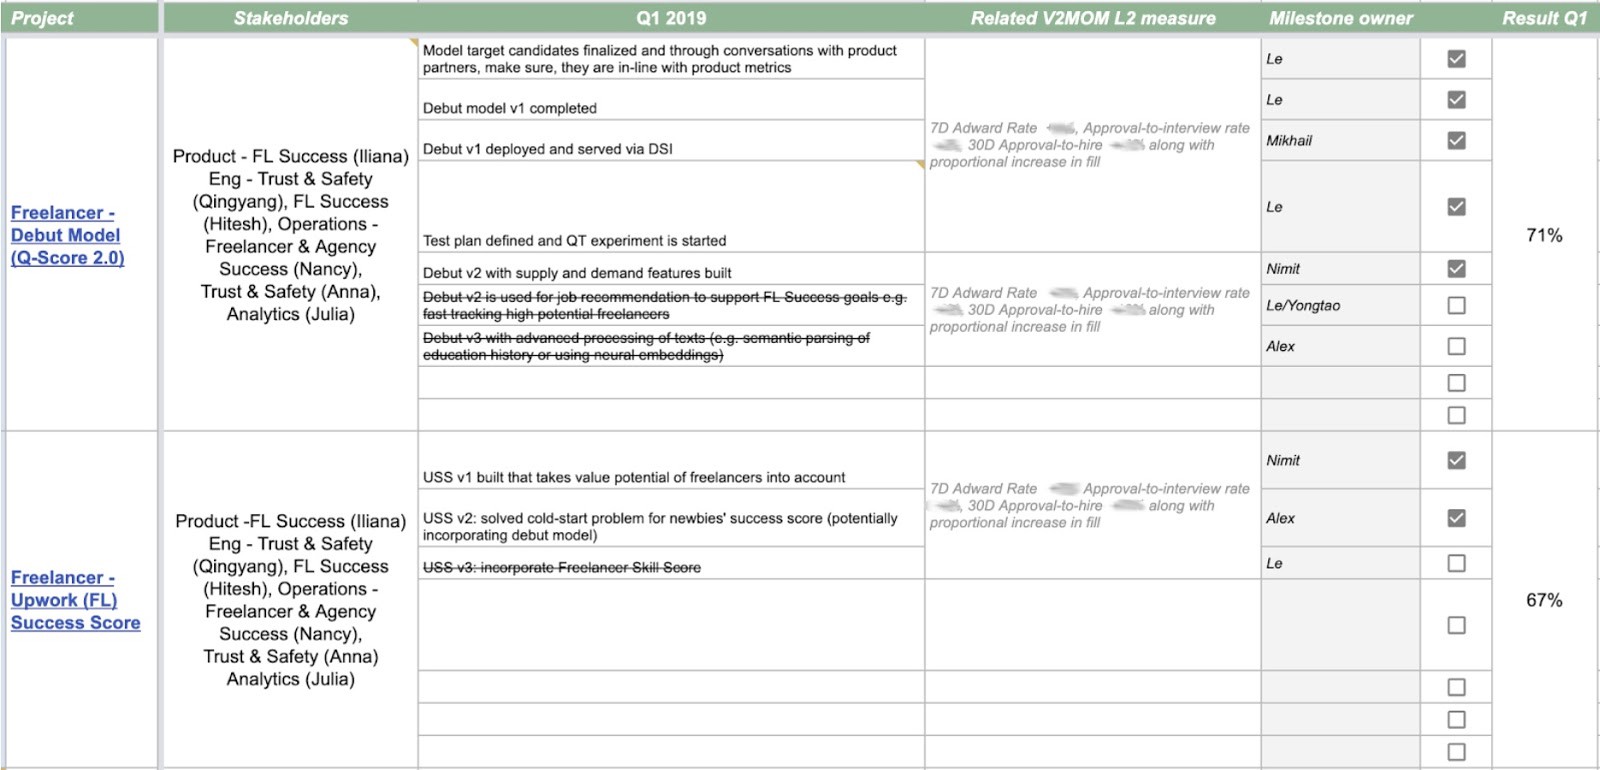
Guided by V2MOM Methods and Measures, we devise a project plan for every quarter. Every project is associated with owners, stakeholders and priority level. A project is further decomposed into milestones with dedicated owners and metric targets. The metrics at this level are typically lead metrics (referred to as L2 metrics), which are behavior-based signals that are more actionable and serve as early indicators for our core business metrics (L1 metrics).
We track metric completion on a monthly basis and establish bi-weekly planning meetings with our team managers to revise targets and to make modifications to the project plan. Just like Jira issues at the level of execution, we keep track of incomplete, aborted and added milestones to understand and improve our gap between planning and execution at the project level.
Linking Strategies and Project Plans with Jira-based Execution
We use Jira Epics and Versions to capture projects and milestones, respectively. As shown below, we know for every Jira issue the associated project and milestone, and via the sheets presented above, we have the certainty it contribute to business metrics.
Put it in a different way, we provide the full context and expect our team members to understand what it takes to deliver value to users, how the values are reflected in behavior-based metrics and how to create Jira issues that are directly linked with value generation.

It takes a few months for us to complete the full cycle but as of now (around 8 months into the full adoption), 98% of our tasks are linked to projects and milestones and 100% of all the milestones are linked to metrics. We have full visibility into performance at the task level, milestone achievements at the project level and metric completions at the team level.
Of course, it is challenging to plan out in detail the behavior impacts (L2 metrics) we should target with every project. And yes, there is huge uncertainty in how these L2 metrics will impact core business metrics. We have to continue to refine our understanding of lead vs. lag metrics and what’s the most impactful way for us to deliver value. But with this mechanics in place, at least we equip team members with the tools and guidelines to plan and execute all their tasks with well defined metric impact.
Iteration 2 — Retrospective
We introduced cycles that involve yearly planning of high-level strategies and targets, quarterly planning of projects and established links between planning a bi-weekly sprint execution. We gained more certainty in ensuring team members are doing the “right” things. With all the context set, the needs to steer and intervene to make sure the team stay on course is much reduced as team members at all levels have become more self-sufficient in planning and more effective in aligning their work to the team’s targets.
This is reflected in improvements in completion rate not only at the task level but also project level. Most importantly, we now have established a clear baseline for metric targets and continuously learn how to improve these metrics in the most systematic way (see our improvements in Q1 Measures vs. Q2 Measures below).

We track measures, milestone completions and story point deliveries quarter over quarter.

While the system in place is fine for a small team, we find frictions in our collaboration as we grow to a team of 30+ members. Please read on if you are interested in the measures we took to improve our team organization.
Iteration 3: Team of Cross-functional Squads
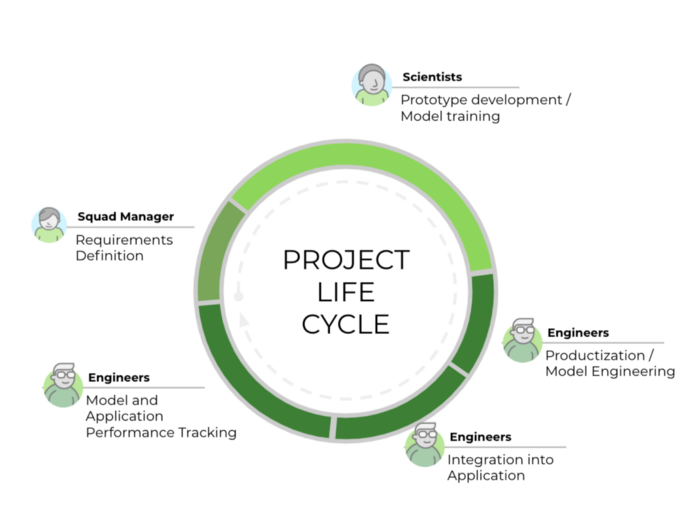
The life cycle of our typical data science project is illustrated below. Together with our product managers and stakeholders, we explore business opportunities and define requirements. Then we build a prototype to provide answers to conceptual uncertainties and verify the product requirements based on offline experiments. The next steps are to devise an implementation plan, verify productionization requirements, ship the product and test our hypothesis defined around metric improvements and end-user values.
Note this is a rather simplified view. In managing the various types of uncertainties, we discussed the needs to close the loops/cycles and to have shorter iterations. The outputs of some cycles might be insights, learnings or decisions instead of deployable code. However, this view helps to illustrate the various roles that need to be in place to provide end-to-end support for data science product development.

Project lifecycle stages and the roles of our team members.
Empowered and Autonomous Cross-functional Squads
To this end, we realize the drawbacks in our current organizational setup: neither of our 2 teams can support the entire project life cycle. This leads to high overhead in communication and coordination and worst of all, there is a lack of team accountability and ownership in terms of projects, products, and metric impact. Besides, we find the typical issues of running large teams: team project planning and task coordination become challenging as we grow in size, our managers are overwhelmed with both managing the team’s outputs and the team member’s career paths, and we frequently run large meetings with low engagement and lack of topical focus.
We address these issues by introducing smaller cross-functional squads. First, we partition our data science team based on topical focus and metric impact: in our previous blog posts [1, 2], we show how the metric impact of our team can be viewed from 1) the user conversion perspective, 2) that there are two sides of the marketplace (i.e client conversion funnel vs. freelancer conversion funnel), and 3) that beyond “single-point” user conversion, there is market level growth and optimization. Guided by these views, we divided our Data Science team into 3 core areas with disjoint sets of targeted metrics and topical specializations. Horizontal to these, there is also the area of Data Science infrastructure and platform.
For every such area, we establish a cross-functional team (called squad). Each has a dedicated manager, a technical lead and team members that can fill both the scientist and engineer role. Every squad manager is responsible for a set of projects and is held accountable for their targeted metrics. Individual squad members have clear milestone ownership and are held accountable for metrics associated with these milestones.
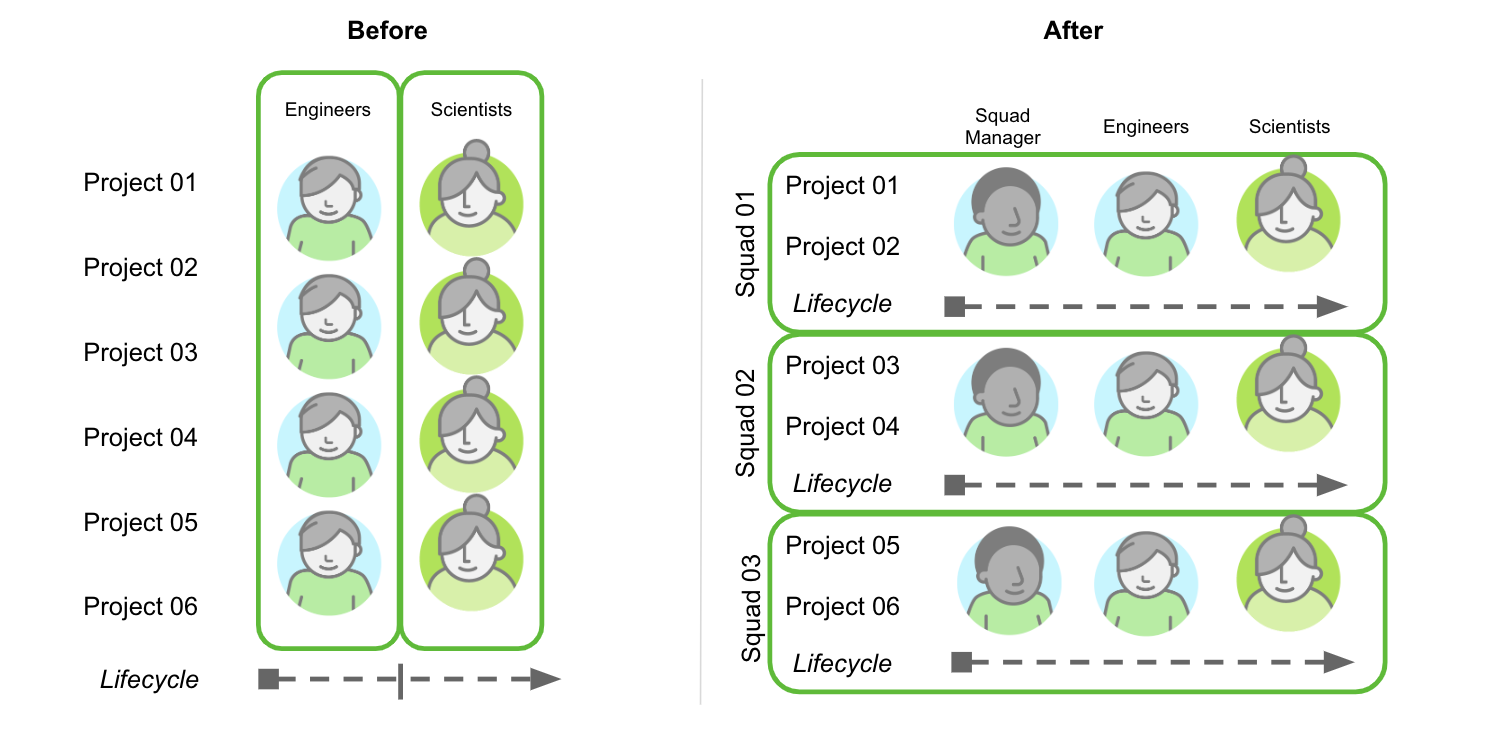
With this new organization design we aim to enforce two core principles we deem most essential for our ability to scale:
- Empowerment: every team is empowered to own critical pieces of the business and incentivized to deliver the highest impact in their area of ownership.
- Autonomy: every team is equipped with the context and resources needed to ensure end-to-end execution and deliveries.
Performance Reporting and Continuous Improvements with Autonomous Squads
Now that we have an autonomous team with a clear project and metric ownership, there is an opportunity for us to fine-tune task execution and planning.
Scrum Rituals, Communication, and Collaboration
We apply the same scrum rituals as discussed before for the smaller and autonomous cross-functional squads. Every squad has its own scrum routine, meetings, team communication channels, and Jira dashboards to plan and execute their tasks. With the increased autonomy, project-based communication and coordination occur mainly within the squad boundaries. For tactical planning and coordination, we run biweekly meetings for squad managers to review V2MoM metrics, update their status of project milestones and discuss project plan changes at the team level.
Performance Reports
In our first iteration, we introduced rudimentary dashboards, which fall short in capturing the team’s progress over time and performance at the individual level of team members. In addition to the Jira dashboards we created for every squad, we now also share an in-depth sprint closure report with the following core components:
- Completion chart at the level of team, squad and team members: capture gaps between planning vs. execution.
- Velocity chart: illustrates the team’s capacity, i.e., the amount of work delivered over time.
- Quarterly milestone completion: track milestone completion at the project level to learn from past quarters and optimize the planning of next quarter.
Actionable Feedback
With these detailed reports in place, we can clearly see individual performances, identify gaps, and capture improvements over time. It is also easier for us to provide feedback and derive concrete data-driven suggestions. See an example in the screenshot below:

Iteration 3 — Retrospective
After rolling out this third set of tools, we saw an increase in sprint over sprint improvements. In the most recent sprint, we reached 91% completion rate, which is the highest recorded to date. This is also reflected in improvements at the project level: the milestone delivery rate has been consistently high and average around 70% for the last two quarters.

Future Work
The best thing about the changes we have made is that now, we have better data that help reveal gaps and potential for improvements at all levels. We’d like to focus on two key areas:
Project Lifecycle Management
While our squads may face different uncertainties, the core lifecycle stages and the minimum level of quality we shoot for is the same. To streamline the management of projects, we are defining a guideline for gate requirements that should be satisfied with every major step of the project lifecycle. The illustration below captures the core requirements we have proposed so far:
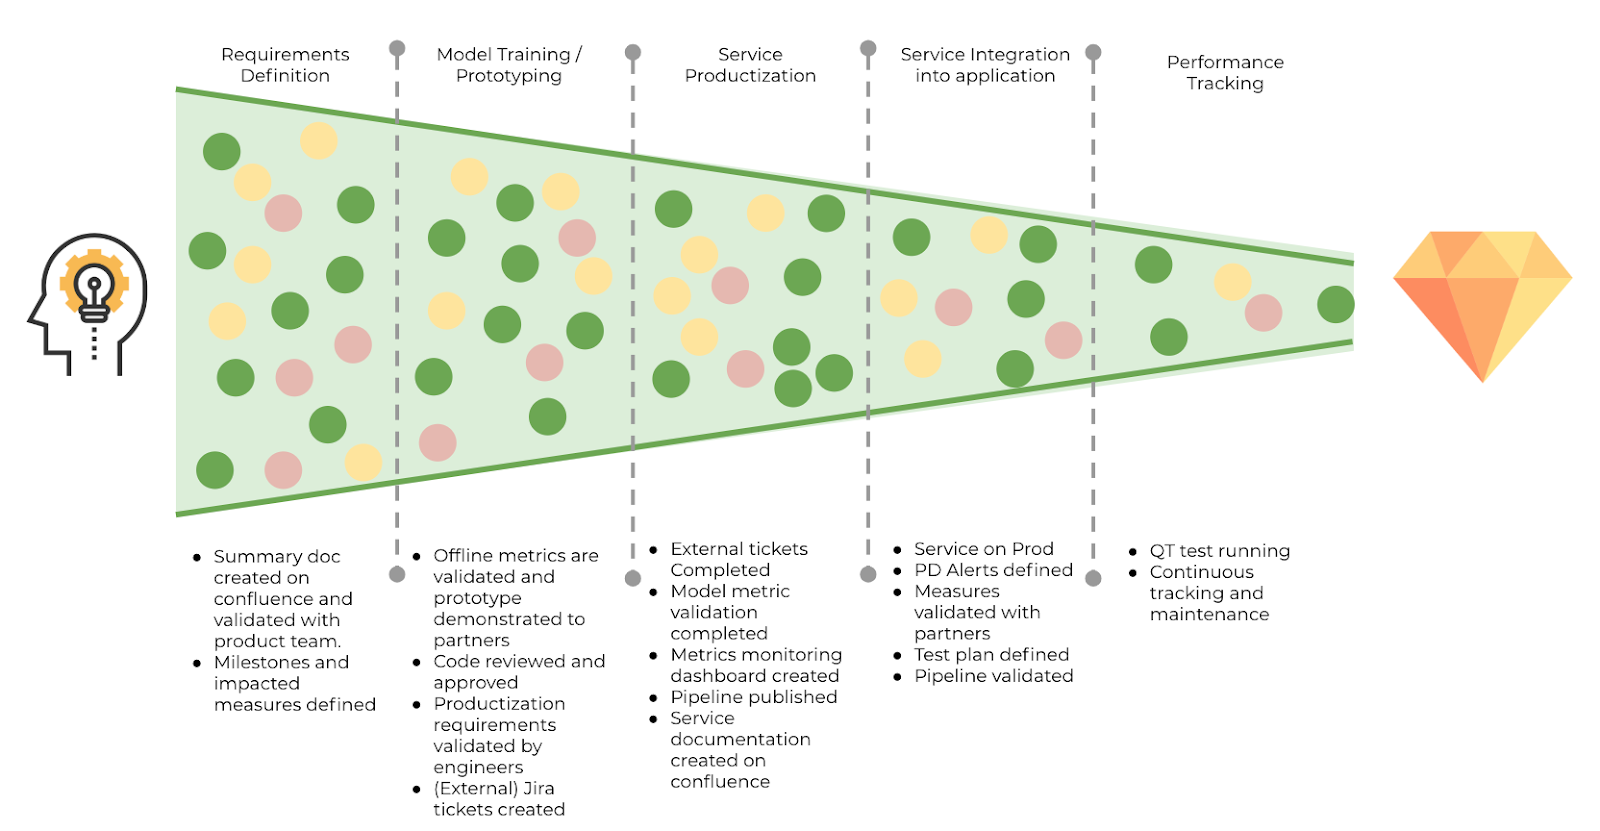
The main challenge with this proposal is how we can balance these requirement checks without introducing unnecessary high overhead? We are testing out this proposal with early adopters and shall revise the checklists to establish core requirements that serve as mandates as well as optional recommendations.
Autonomy and Continuous Improvement at the Level of Individual Team Members
While all our team members are very engaged in the definition and execution of tasks, the majority of the work required for tracking progress and making planning adjustments is being carried out by the squad managers. This is reflected in higher management overhead and more importantly, lack of empowerment and ownership. Just like how the squads have become more empowered and autonomous, we’d like all team members to be more knowledgeable about the business context and goals, actively participate in the planning of projects and milestones, and help track and take greater ownership in the completion of project milestones and business metrics.
We think this is best achieved by tying the increase of ownership and success in milestone and metric completions to individual career goals & growth. To achieve this, we shall track improvements not only at the task level but collect data points at the project and strategy levels. We shall track the team member’s progress in terms of methods, milestones, and measures and use these data points to help guide career conversations and promotion decisions.


.png)
%20(1).jpg)