You will get Executive Power BI Dashboard for Sales, Finance & Operations
Project details
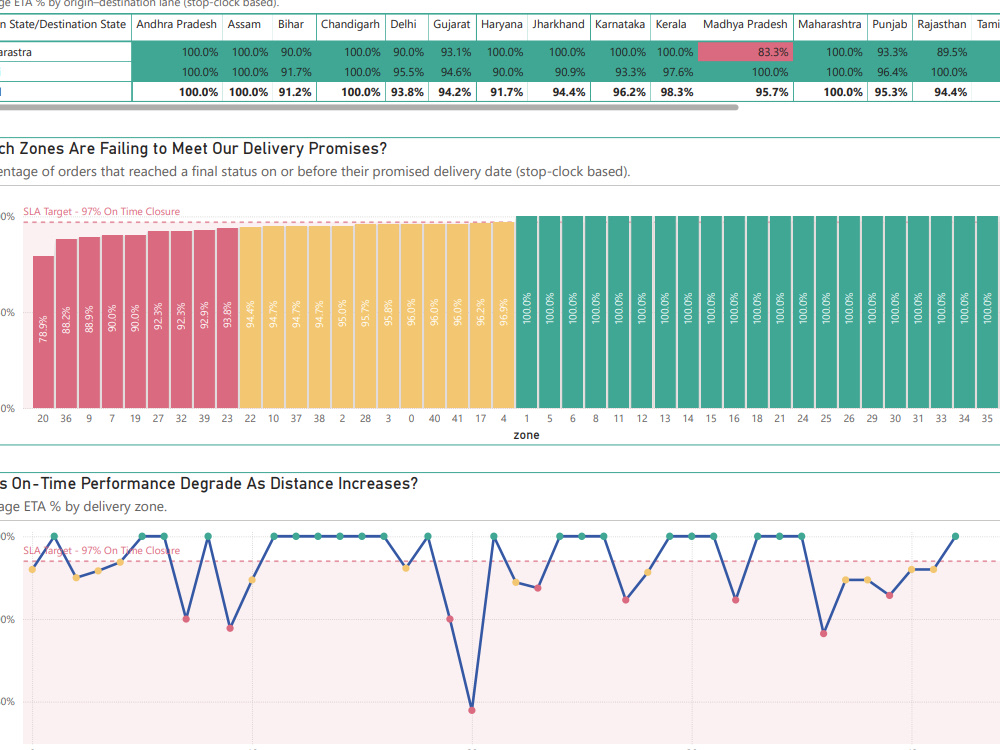
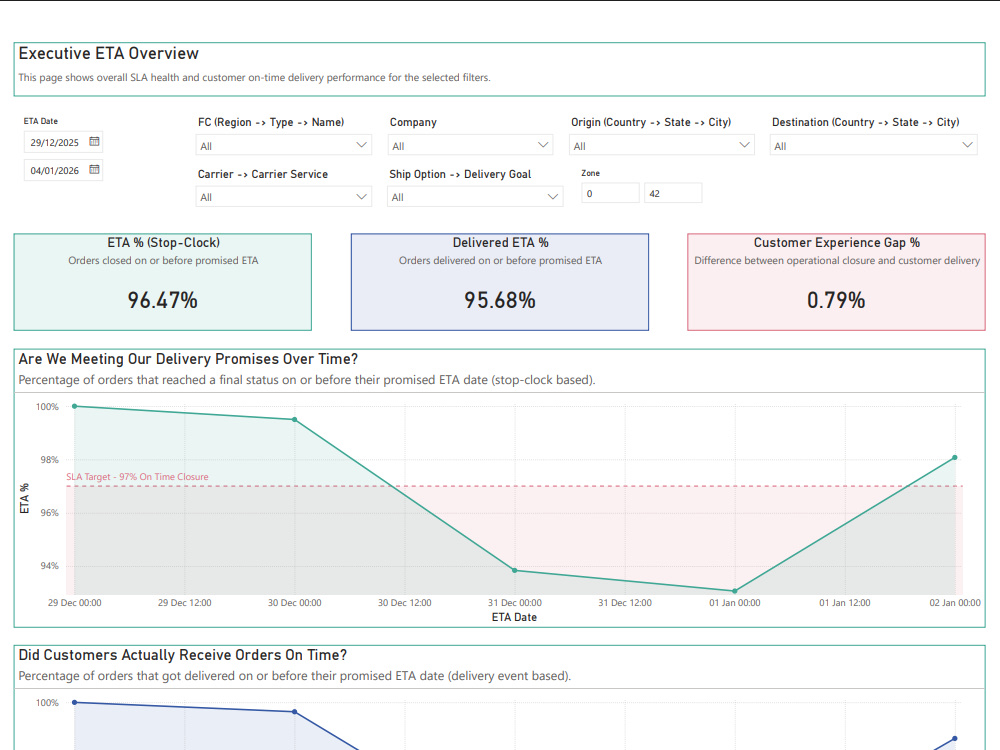
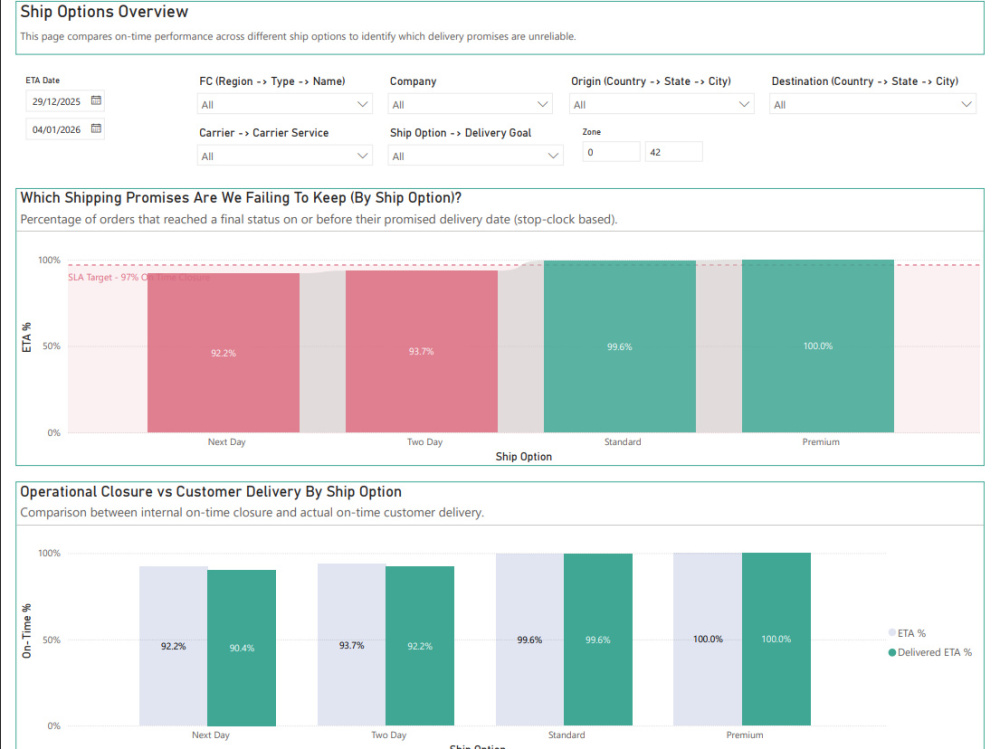
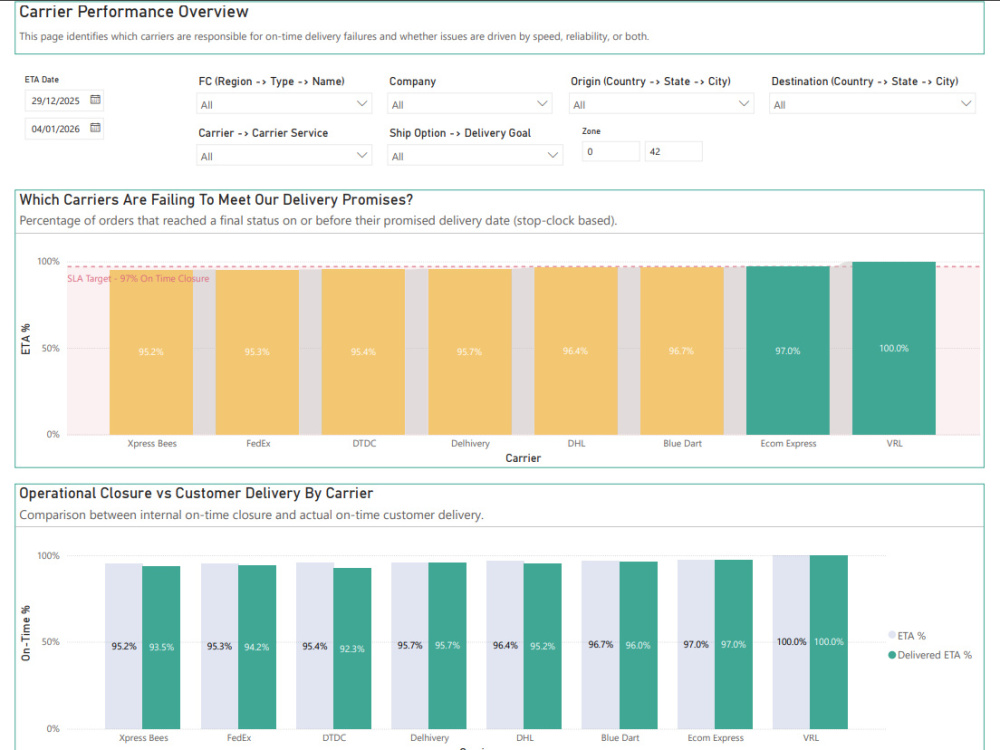
I will design a custom Power BI dashboard that transforms your raw data into clear, actionable insights.
This dashboard is built for decision-makers who want instant visibility into key KPIs, trends, and performance drivers without digging through spreadsheets.
My approach focuses on clarity, accuracy, and business storytelling. Whether you’re tracking sales, finance, operations, or overall business health, the dashboard will be structured to answer the most important questions quickly and visually.
You’ll receive a polished, interactive Power BI report with optimized data models, meaningful KPIs, and an intuitive layout designed for real business use, not just visuals.
This project is ideal for founders, managers, and leadership teams who want reliable insights and a dashboard they can actually use.
This dashboard is built for decision-makers who want instant visibility into key KPIs, trends, and performance drivers without digging through spreadsheets.
My approach focuses on clarity, accuracy, and business storytelling. Whether you’re tracking sales, finance, operations, or overall business health, the dashboard will be structured to answer the most important questions quickly and visually.
You’ll receive a polished, interactive Power BI report with optimized data models, meaningful KPIs, and an intuitive layout designed for real business use, not just visuals.
This project is ideal for founders, managers, and leadership teams who want reliable insights and a dashboard they can actually use.
Data Tool
Microsoft Power BIWhat's included
| Service Tiers |
Starter
$49
|
Standard
$199
|
Advanced
$449
|
|---|---|---|---|
| Delivery Time | 2 days | 4 days | 6 days |
Number of Revisions | 1 | 3 | 5 |
Number of Graphs/Charts | 5 | 10 | 15 |
Data Source Connectivity | - | ||
Web Embedding | - | - | |
Interactive/Animated Visuals |
Optional add-ons
You can add these on the next page.
Fast Delivery
+$20 - $150
Additional Graph/Chart
(+ 1 Day)
+$10Frequently asked questions
About Anirudh
Senior BI Analyst | Power BI, Tableau, Sql, KPI Dashboards
Delhi, India - 4:33 pm local time
I help companies turn raw, messy data into clear dashboards and decision-ready insights that leaders actually use.
I’m a Senior Supply Chain & Business Intelligence Analyst with hands-on experience building analytics solutions across logistics, operations, finance, and sales. My work has supported CXOs, ops leaders, and consulting teams in making faster, data-backed decisions.
⬤ What I do best:
1. Power BI, Google Looker Studio & Tableau dashboards (executive, operational, financial)
2. KPI frameworks & performance tracking (YoY, MoM, targets vs actuals)
3. Data modelling & lightweight ETL from Excel, CSVs, SQL databases
4. Automation & reporting optimization to eliminate manual work
⬤ Proven impact from recent work:
1. Improved shipping time by 18% and last-mile efficiency by 12% through analytics-led decisioning
2. Reduced reporting and planning effort by up to 71% via automated dashboards
3. Identified double-digit cost savings across freight, packaging, and inventory flows
4. Built KPI scorecards and diagnostics used weekly by leadership teams
⬤ How I work:
1. Start with business questions, not just charts
2. Keep solutions clean, scalable, and easy to maintain
3. Deliver fast first drafts, then iterate quickly based on feedback
4. Provide clear handoff documentation so you’re never dependent on me
⬤ Tools:
Power BI, Tableau, Google Looker Studio, SQL, Python, Excel, Google Sheets
(Experience with financial reporting, sales performance, supply chain, and operations data)
If you’re looking for someone who can move fast, think like a business owner, and deliver dashboards that drive action, not just visuals, let’s talk.
Steps for completing your project
After purchasing the project, send requirements so Anirudh can start the project.
Delivery time starts when Anirudh receives requirements from you.
Anirudh works on your project following the steps below.
Revisions may occur after the delivery date.
Requirements & Data Review
I review your data, business goals, KPIs, and dashboard expectations.
Dashboard Design & Development
I build the Power BI dashboard with data modeling, measures, visuals, and interactivity.