You will get Power BI Dashboard Design & Data Analytics
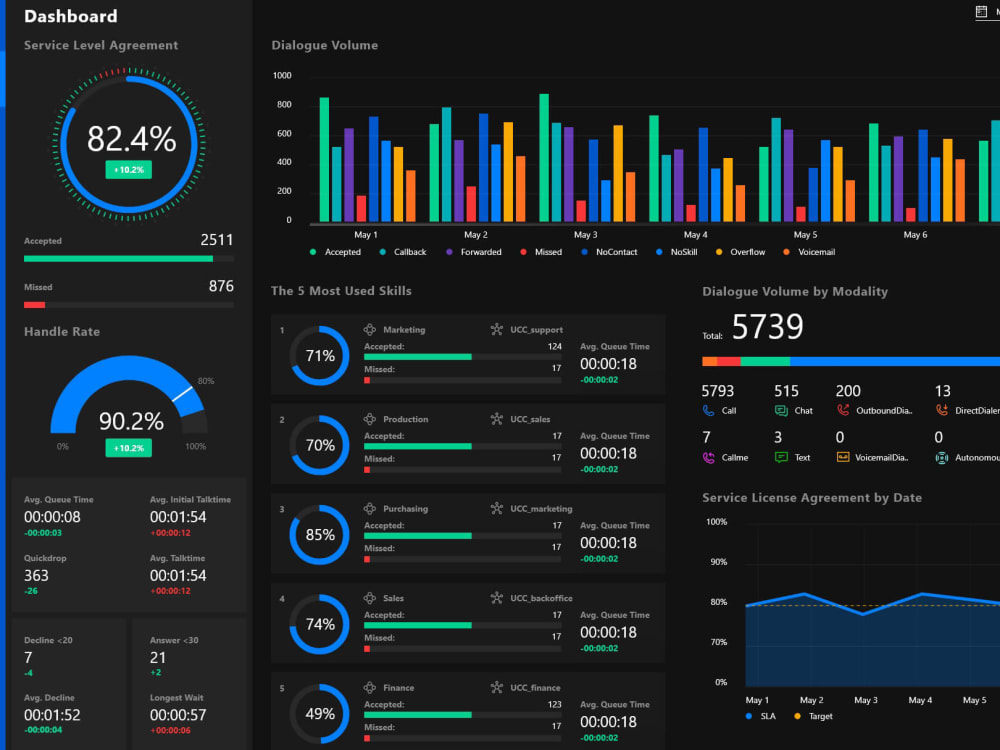
Project details
What sets me and my project apart is a unique blend of deep analytical expertise and creative data visualization skills. With a strong background in data analysis and a passion for storytelling, I transform raw data into meaningful insights that resonate with audiences. My project goes beyond traditional analysis by delving into the rich history of the Tour de France, capturing its essence through interactive visualizations and engaging dashboards. By leveraging advanced Power BI techniques, I bring the race's evolution to life, enabling viewers to explore trends, discover standout performances, and uncover historical milestones. The fusion of technical proficiency, an eye for design, and a commitment to delivering actionable insights distinguishes both my approach and the project, ensuring a compelling and impactful data-driven narrative.
Data Tool
Microsoft Power BIWhat's included
| Service Tiers |
Starter
$100
|
Standard
$120
|
Advanced
$140
|
|---|---|---|---|
| Delivery Time | 5 days | 4 days | 3 days |
Number of Revisions | 1 | 2 | 3 |
Number of Graphs/Charts | 2 | 2 | 2 |
Number of Variations | 2 | 2 | 2 |
Data Source Connectivity | |||
Web Embedding | |||
Interactive/Animated Visuals |
Optional add-ons
You can add these on the next page.
Fast Delivery
+$10
Additional Revision
+$10
Additional Variation
(+ 1 Day)
+$10Frequently asked questions
About Backlo
Microsoft Certified Power BI Data Analyst | Academic Writer
Nairobi, Kenya - 7:53 am local time
Steps for completing your project
After purchasing the project, send requirements so Backlo can start the project.
Delivery time starts when Backlo receives requirements from you.
Backlo works on your project following the steps below.
Revisions may occur after the delivery date.
Data Preparation and Transformation
Import Data: Gather data from various sources, such as databases, Excel files, APIs, or web sources, into Power BI. Data Transformation: Use Power Query to clean, reshape, and combine data.
Data Modeling and Visualization
Data Model Design: Build a logical data model that defines the structure and relationships between tables. Visualization Creation: Design and create visualizations that effectively represent the insights you want to convey.