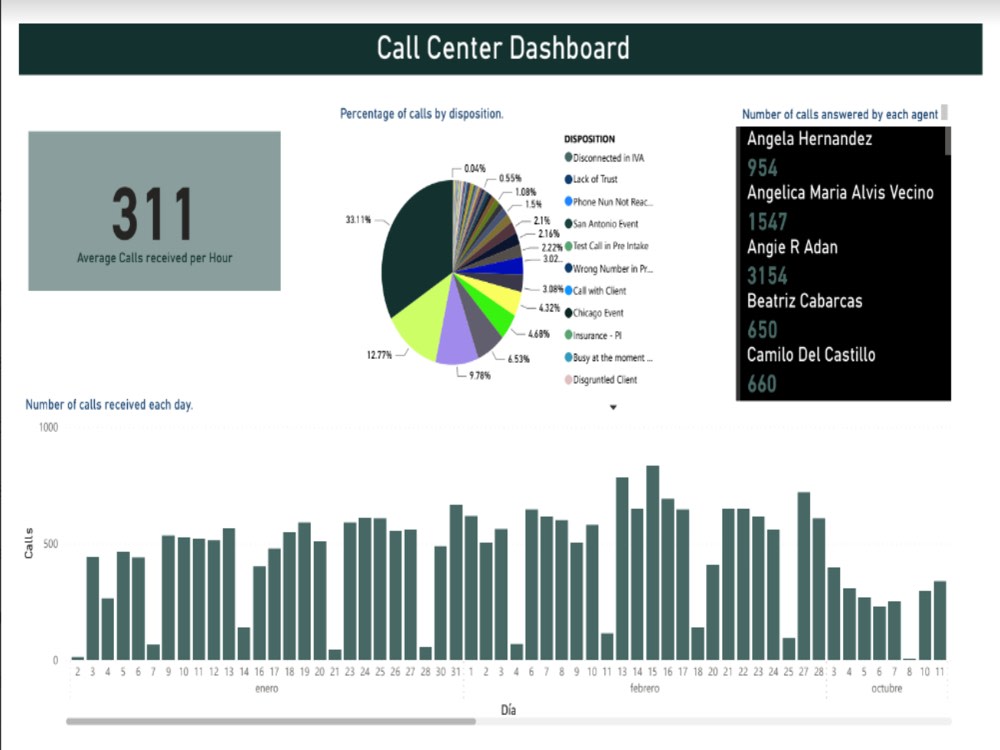
You will get dashboard call center report
Project details
What sets me and my project apart is the meticulous approach and the ability to derive meaningful insights from complex datasets. By leveraging Power BI’s advanced features, I created a visually appealing and highly functional dashboard that not only displays key metrics but also enhances decision-making. My project stands out due to its seamless integration of data visualization and user experience, providing a comprehensive and intuitive overview of call center performance. This ensures stakeholders can easily interpret the data and make informed decisions
Data Entry Type
Data Cleansing, Document Conversion, Error DetectionData Entry Tool
Microsoft ExcelWhat's included
| Service Tiers |
Starter
$20
|
Standard
$25
|
Advanced
$35
|
|---|---|---|---|
| Delivery Time | 1 day | 1 day | 1 day |
Number of Revisions | 1 | 1 | 2 |
Number of Hours of Work | 6 | 6 | 6 |
Formatting & Clean Up | |||
Graph & Table Creation |
About nathalia
Business Manager - Data Analyst Knowledge
Bogota, Colombia - 7:11 am local time
Steps for completing your project
After purchasing the project, send requirements so nathalia can start the project.
Delivery time starts when nathalia receives requirements from you.
nathalia works on your project following the steps below.
Revisions may occur after the delivery date.
CLEAN DE DATA SET
FIND SOME ERROR OR EMPTY DATA WITHIN DE DATA SET
ECUATIONS
DEPENDS ON THE INFORMATION, MAKE SOME FORMULAS TO FIND VALUABLE INSIGHTS