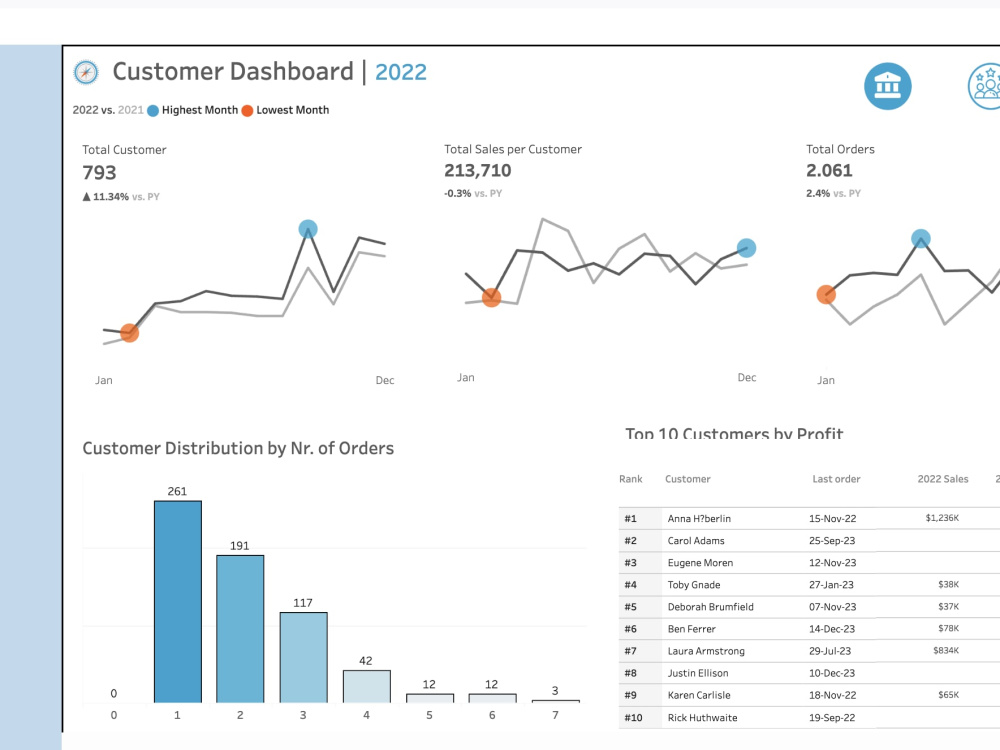
You will get Dashboard Embedded in Website/App
Top Rated
Top Rated
Project details
Your dashboard will be presented in a clear, well-organized, and user-friendly design, with the flexibility to choose your preferred output format, such as a website or application, without any watermarks or Tableau/PowerBI branding.
Main Type
Email Templates, Landing Pages, Mobile Apps, Web Apps, Website, OtherWhat's included $100
These options are included with the project scope.
$100
- Delivery Time 7 days
- Number of Revisions 0
- Source Files
Optional add-ons
You can add these on the next page.
Fast 5 Days Delivery
+$200
Additional Revision
+$100
6 reviews
(5)
(1)
(0)
(0)
(0)
This project doesn't have any reviews.
MD
Meet D.
Feb 10, 2026
Senior Data Analyst / Power BI Expert (Custom Visuals, Fabric, Data Pipelines)
⭐⭐⭐⭐⭐
Chirag delivered expert-level Power BI work with strong DAX, advanced time intelligence, and excellent performance optimization. Communication was clear and proactive, and the final solution was truly production-grade. Highly recommended and would gladly rehire.
Chirag delivered expert-level Power BI work with strong DAX, advanced time intelligence, and excellent performance optimization. Communication was clear and proactive, and the final solution was truly production-grade. Highly recommended and would gladly rehire.
AP
AJ P.
Dec 22, 2025
Tableau work on assignments
Pansuriya did a great job!
I would work with him again!
I would work with him again!
KS
Kumar S.
Nov 18, 2025
Tableau Developer
FK
Fahima Hazzana Parveen K.
Jul 30, 2025
Tableau Dashboard Supprt
It was a great experience working with Chirag. He was polite, professional, and highly skilled in Tableau. He quickly understood my requirements and delivered well-thought-out KPIs. I would highly recommend him for any Tableau-related tasks. A solid 5-star performance!" 🌟🌟🌟🌟🌟
SA
Sachin A.
Mar 11, 2025
Power BI Developer | SQL, DAX, Excel | Data Visualization & Automation
Chirag is an exceptional Power BI developer with deep expertise in SQL, DAX, and Excel-based data visualization. He delivered high-quality, interactive dashboards and automated reporting solutions with precision and efficiency. His technical proficiency, problem-solving skills, and professionalism made the entire project seamless—highly recommended!
About Pansuriya
Pro Power BI | Tableau Developer | API | R | Athena
100%
Job Success
Virpur, India - 8:17 am local time
☁️ 𝗧𝗮𝗯𝗹𝗲𝗮𝘂 𝗖𝗹𝗼𝘂𝗱 | 𝗠𝗶𝗰𝗿𝗼𝘀𝗼𝗳𝘁 𝗙𝗮𝗯𝗿𝗶𝗰 | 𝗔𝗣𝗜 & 𝗗𝗮𝘁𝗮 𝗜𝗻𝘁𝗲𝗴𝗿𝗮𝘁𝗶𝗼𝗻𝘀 | 𝗚𝗣𝗧-𝗣𝗼𝘄𝗲𝗿𝗲𝗱 𝗕𝗜 𝗦𝘆𝘀𝘁𝗲𝗺𝘀
I don’t just build dashboards — I design decision engines.
I’m a results-driven Business Intelligence & Data Analytics Consultant specializing in end-to-end data solutions — from raw data extraction and modeling to AI-powered visual intelligence across platforms.
I’ve delivered enterprise-grade analytics systems for companies across the U.S., Canada, and India, including a 70+ KPI M&A dashboard deployed on Microsoft Fabric, helping leadership make acquisition decisions using clear, simplified insights.
🔥 Technical Expertise
I don’t only handle the visuals — I solve complex data and system problems:
✅ Advanced SQL & Custom Query Design for scalable data models
✅ Big data analysis using Google BigQuery and AWS Athena
✅ CRM Data Modeling & Analytics using Salesforce
✅ API, OData, ServiceTitan, and Web Integrations
✅ Debugging complex Power BI API issues, ODBC & Gateway errors
✅ AI-powered dashboards integrating ChatGPT / GPT APIs into Tableau
✅ Performance-optimized DAX, Tableau LODs, and calculated fields
✅ Automated pipelines using Python + Google Apps Script
🛠️ Tools & Technologies
Business Intelligence & Visualization
✔️ Tableau (Advanced: LODs, Sets, Actions, Tableau Cloud)
✔️ Power BI (DAX, Power Query, Modeling, MS Fabric)
✔️ Google Looker Studio
Data Engineering & Querying
✔️ SQL (Advanced, Performance Tuning)
✔️ AWS Athena
✔️ Google BigQuery
✔️ Custom ETL Queries
✔️ Salesforce Data Extraction & Reporting
Automation & Programming
✔️ Python (Data pipelines, automation, transformations)
✔️ R (Statistical analysis, visualization, forecasting)
✔️ Google Apps Script
✔️ REST APIs, OData, JSON
✔️ ODBC / Web Data Connectors
📊 What I Build
Executive-level M&A & Financial Dashboards
Big Data Analytics using BigQuery & Athena
Salesforce CRM Performance Dashboards
AI-integrated BI Systems
Revenue, Funnel & Cohort Analysis Dashboards
Automated, Scalable Data Reporting Systems
🚀 Proven Impact:
Delivered 70+ KPIs for acquisition decision systems
Reduced manual reporting by 75%+ through automation
Solved high-complexity data integration & performance issues
Built cross-platform data stacks for US & Canada businesses
✅ Why Clients Trust Me:
✔️ Deep technical stack (SQL → BI → AI)
✔️ Real problem-solving, not template dashboards
✔️ Proven experience with large data volumes & complex logic
✔️ Clear communication with business stakeholders
Steps for completing your project
After purchasing the project, send requirements so Pansuriya can start the project.
Delivery time starts when Pansuriya receives requirements from you.
Pansuriya works on your project following the steps below.
Revisions may occur after the delivery date.
Data Collection
Ask client to provide datasources
Cleaning and Visualization
Cleaning the data and create a dashboard as per Client's need.