You will get SaaS Dashboard Audit & Optimization







Project details
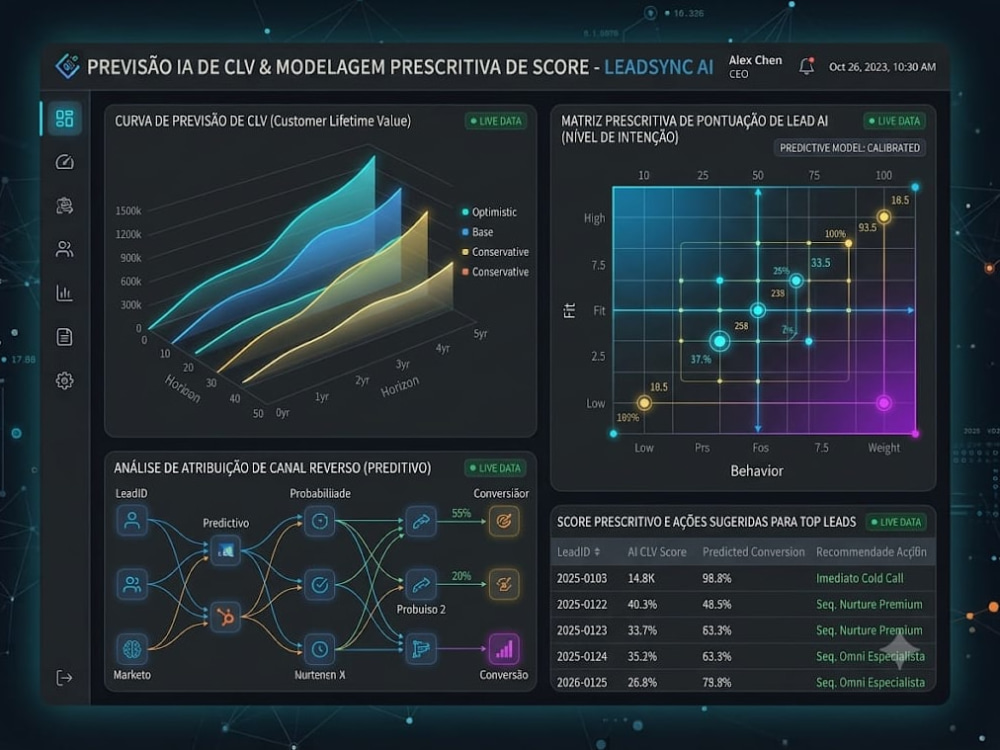
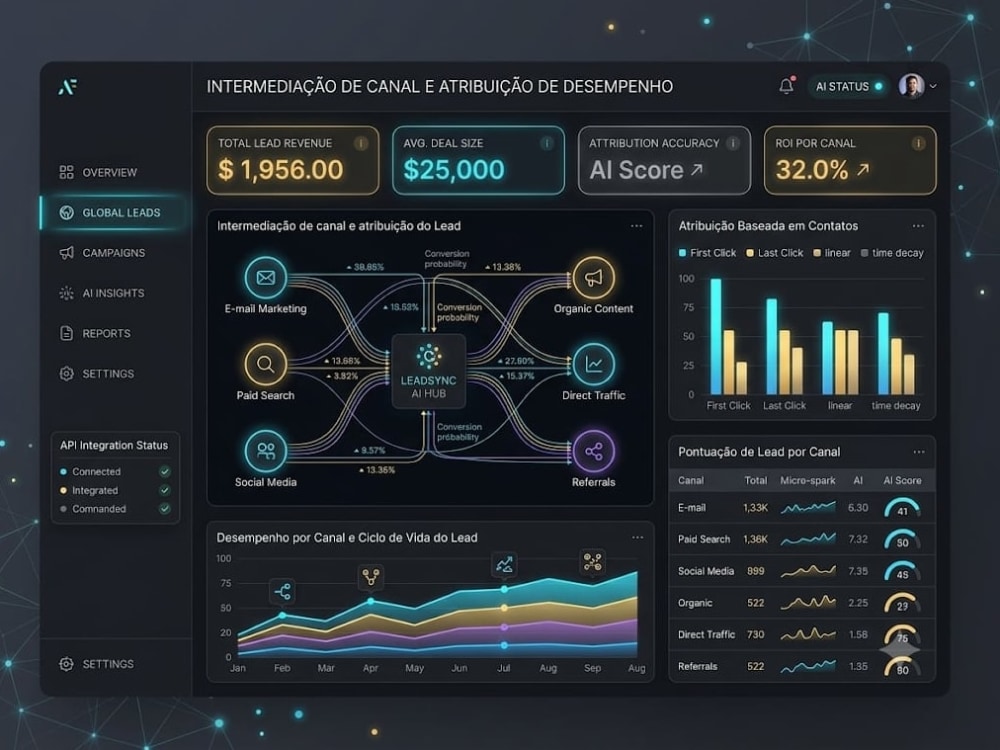
I design high-density, dark-mode FinTech dashboards that eliminate user churn and accelerate decision-making for SaaS platforms. Expert in transforming complex analytics into intuitive, enterprise-grade interfaces that drive user retention and platform performance.
Main Type
Web AppsFile Format
PDF, PNG, AIWhat's included
| Service Tiers |
Starter
$1,499
|
Standard
$3,499
|
Advanced
$7,500
|
|---|---|---|---|
| Delivery Time | 3 days | 7 days | 14 days |
Number of Pages | 1 | 20 | 50 |
Number of Revisions | 2 | 3 | Unlimited |
Source Files | - | ||
Commercial Use | |||
Convert to HTML/CSS | - | - | - |
Responsive Design | |||
Interactive Mockup |
Optional add-ons
You can add these on the next page.
Priority 48h Audit
+$999
User Journey Deep Dive
+$499Frequently asked questions
About Andre
SaaS Growth Architect: AI-Powered Dashboards to Slash Churn & Scale
Campinas, Brazil - 10:19 am local time
I don't just design dashboards; I build high-performance, data-driven interfaces for SaaS platforms. My specialty lies in identifying the friction points that kill user growth and deploying AI-driven solutions (n8n, OpenAI) that slash churn.
With 20 years of operations management experience, I bridge the gap between complex data and intuitive user experience.
My Expertise:
- SaaS UI/UX Audit: Pinpointing churn-driving bottlenecks.
- AI-Driven Dashboards: Building decision-optimized interfaces.
- Product-Led Growth: Aligning UX with business KPIs.
If your product suffers from high churn and poor dashboard clarity, let’s talk. I am here to help you scale.
Steps for completing your project
After purchasing the project, send requirements so Andre can start the project.
Delivery time starts when Andre receives requirements from you.
Andre works on your project following the steps below.
Revisions may occur after the delivery date.
UI/UX Audit & Design Strategy
Audit of your SaaS dashboard to find UI bottlenecks and churn points. I will define the visual strategy and high-density structure to ensure your metrics drive user retention and faster decision-making for your platform users.
Low-Fidelity Wireframing
Drafting the skeleton of your dashboard to optimize the user flow and prioritize key data points before applying visual styles.