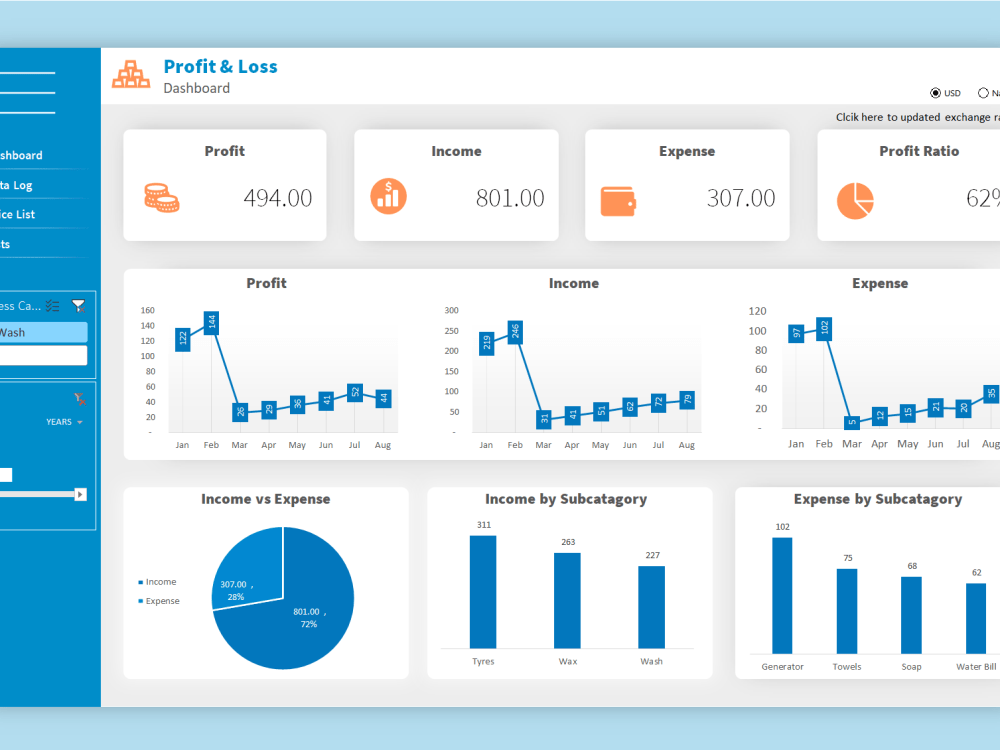
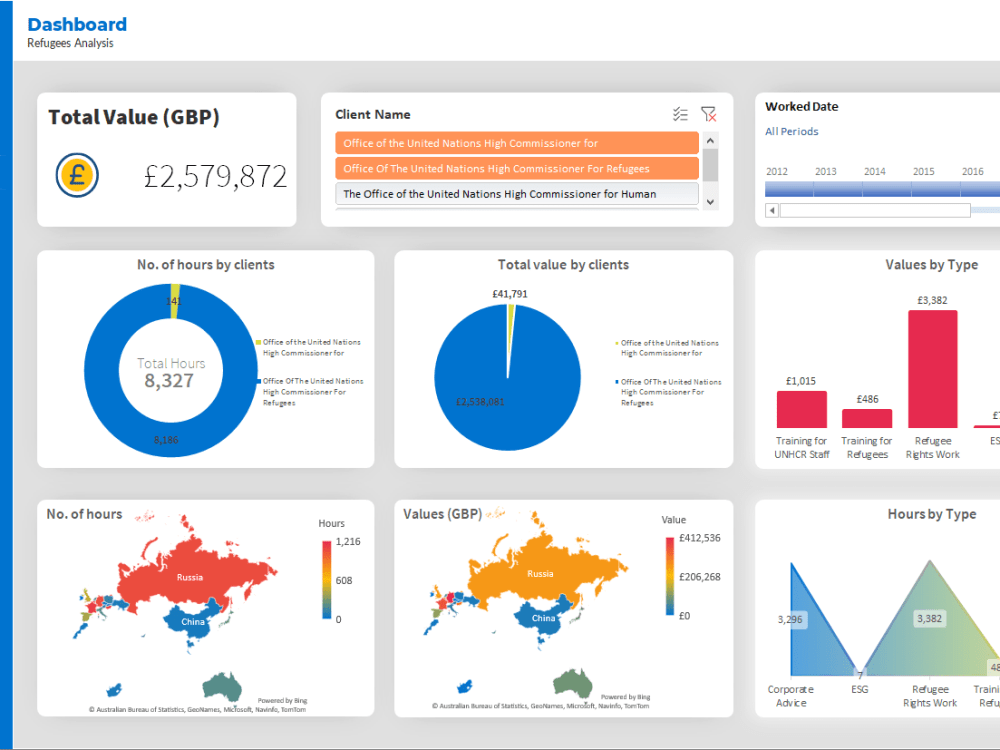
You will get Interactive & Automated Dashboards in Excel or Google Sheets
Project details
🚀 Boost Your Business with a Custom-Built Dashboard! 🚀
Are you struggling with data analysis, reporting, or visualization? I specialize in creating highly interactive, automated, and visually appealing dashboards in Excel & Google Sheets to help businesses make informed decisions.
What I Offer:
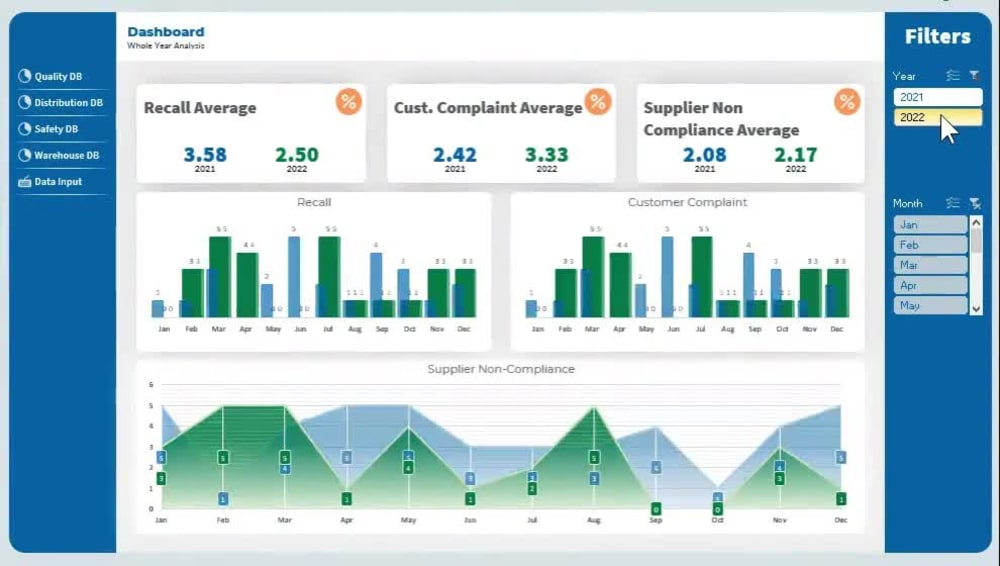
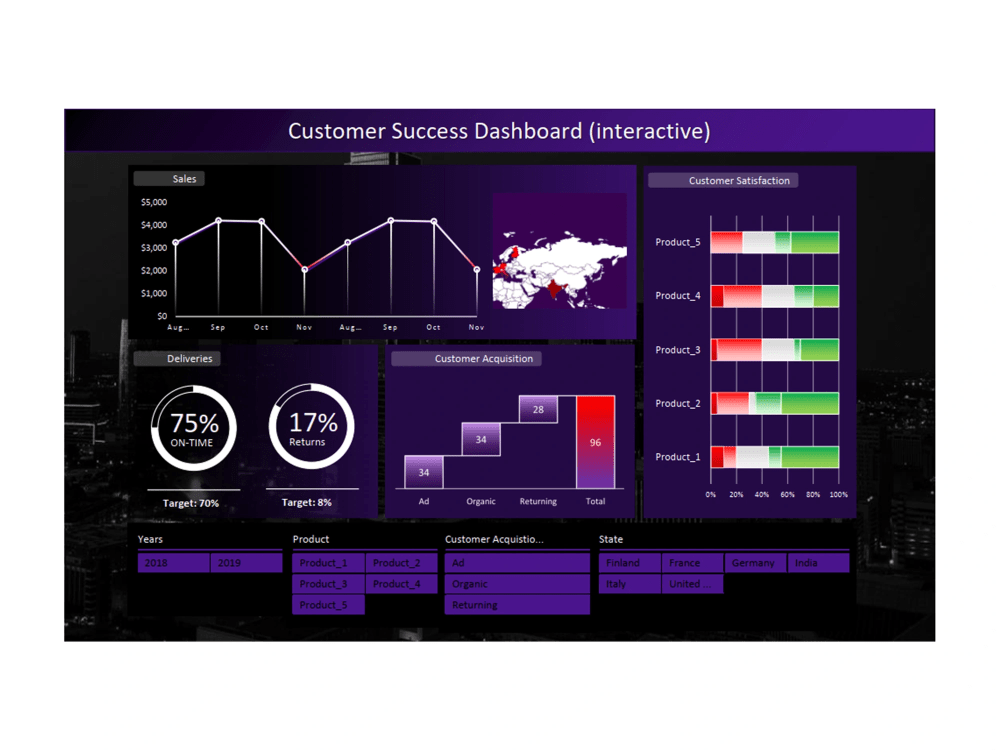
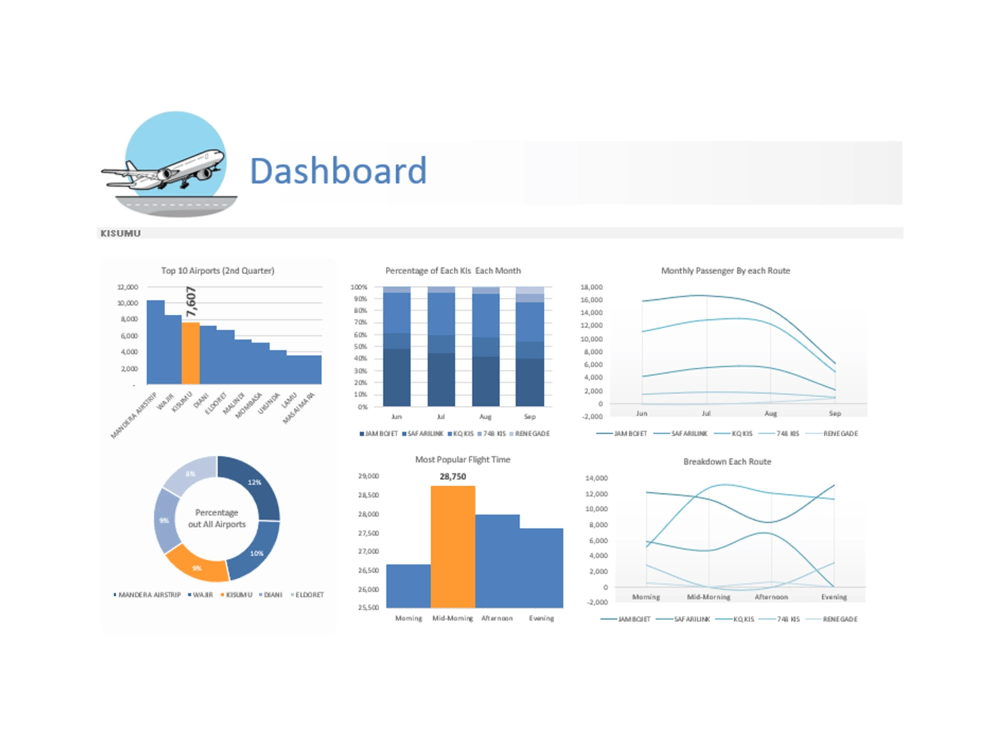
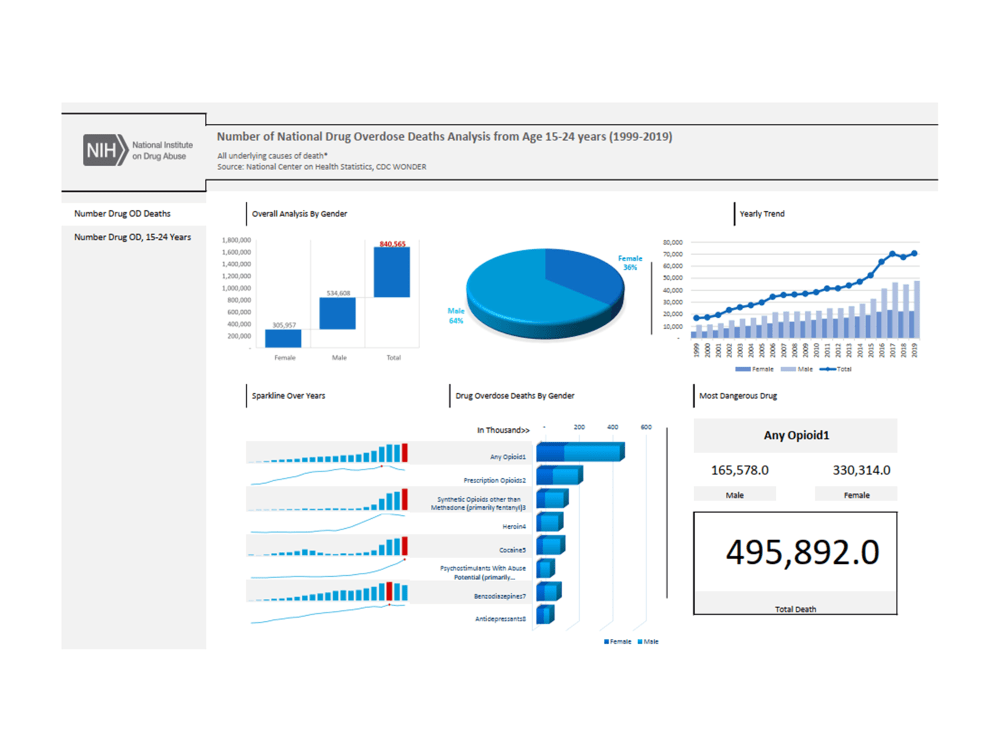
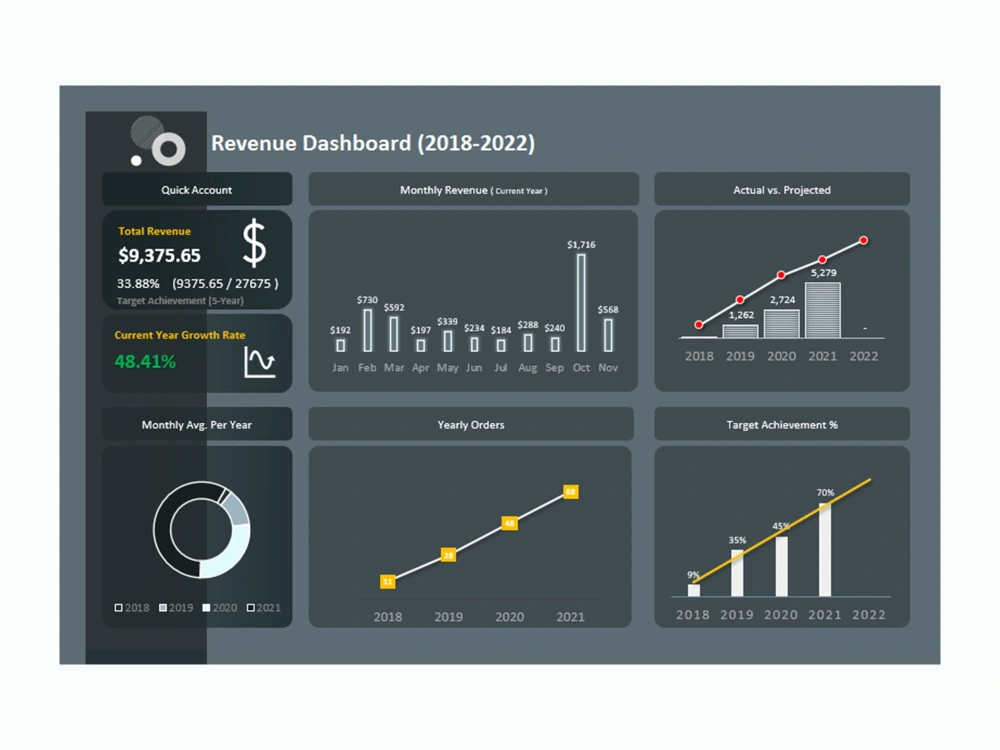
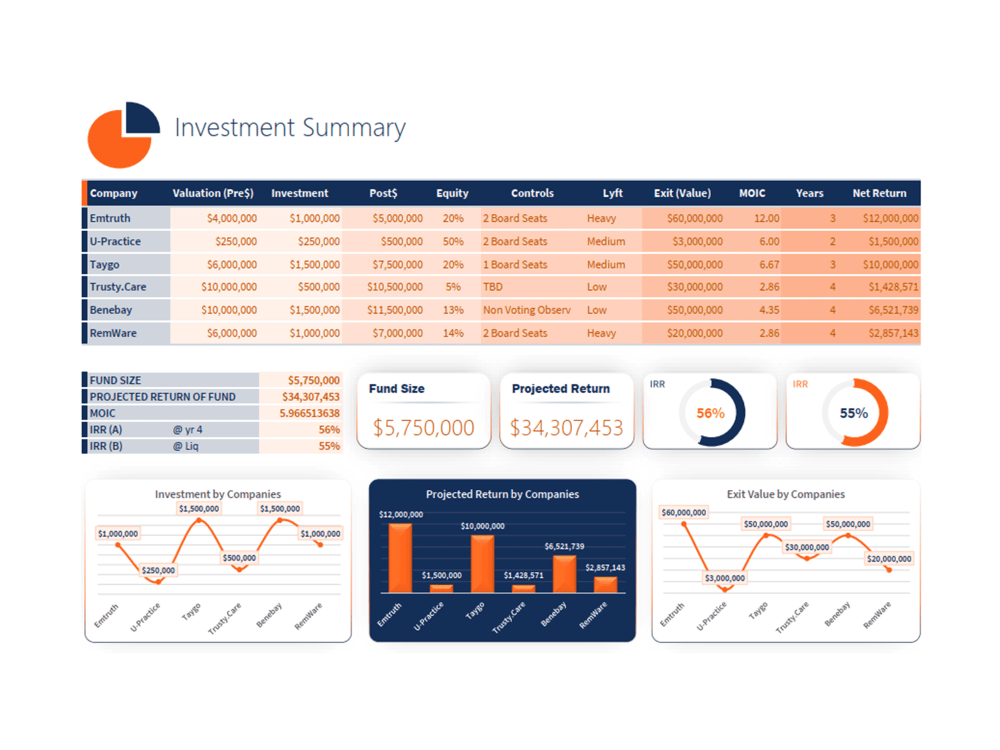
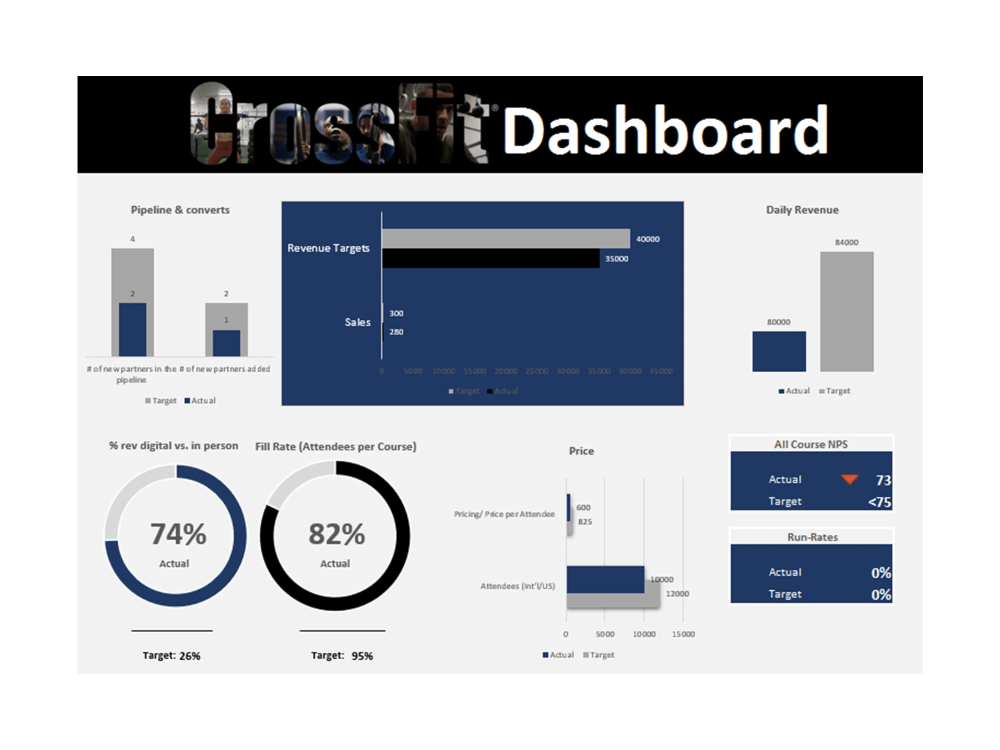
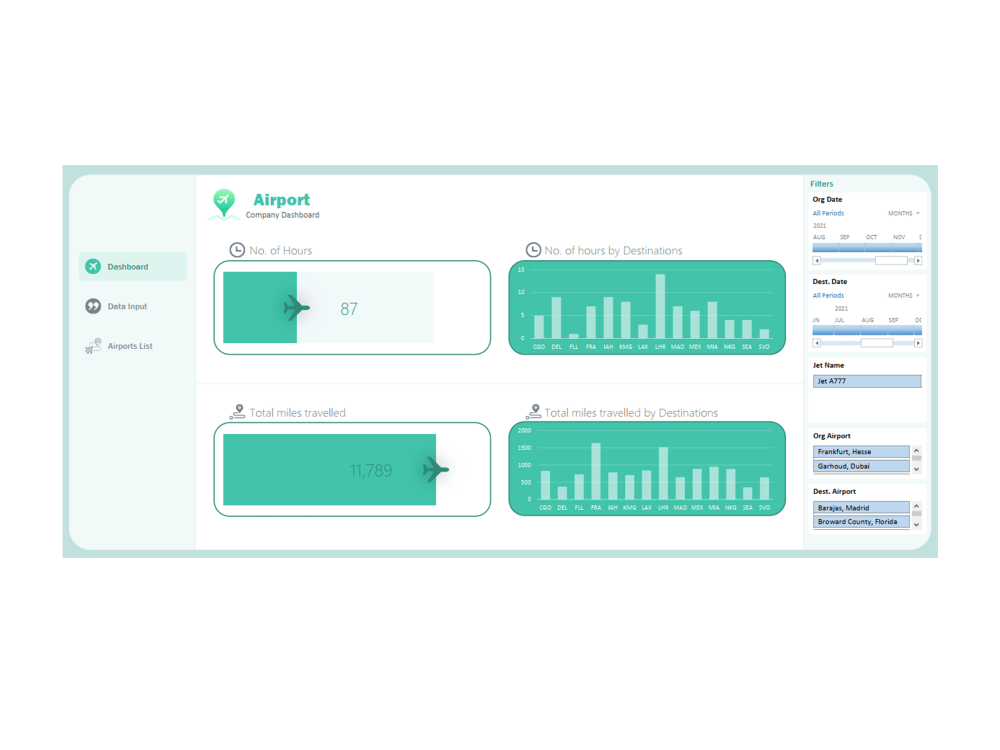
✅ Fully Automated Dashboards – No manual updates required
✅ Interactive Data Visualization – Graphs, charts, and KPIs
✅ Google Sheets & Excel Expertise – Advanced formulas, pivot tables, macros & Google Apps Script
✅ Real-Time Data Analysis – Connect external sources (APIs, databases, or live feeds)
✅ Custom Reports & Insights – Tailored for business, sales, finance, or HR needs
💡 Ideal for:
Business Owners & Startups
Financial Analysts
Marketing & Sales Teams
HR & Operations Managers
E-commerce
🚀 Let’s transform your data into actionable insights! 🚀
📊 Order Now or Message Me for a Custom Quote!
Are you struggling with data analysis, reporting, or visualization? I specialize in creating highly interactive, automated, and visually appealing dashboards in Excel & Google Sheets to help businesses make informed decisions.
What I Offer:
✅ Fully Automated Dashboards – No manual updates required
✅ Interactive Data Visualization – Graphs, charts, and KPIs
✅ Google Sheets & Excel Expertise – Advanced formulas, pivot tables, macros & Google Apps Script
✅ Real-Time Data Analysis – Connect external sources (APIs, databases, or live feeds)
✅ Custom Reports & Insights – Tailored for business, sales, finance, or HR needs
💡 Ideal for:
Business Owners & Startups
Financial Analysts
Marketing & Sales Teams
HR & Operations Managers
E-commerce
🚀 Let’s transform your data into actionable insights! 🚀
📊 Order Now or Message Me for a Custom Quote!
Data Tool
Microsoft ExcelWhat's included
| Service Tiers |
Starter
$30
|
Standard
$65
|
Advanced
$90
|
|---|---|---|---|
| Delivery Time | 2 days | 3 days | 5 days |
Number of Revisions | Unlimited | Unlimited | Unlimited |
Number of Graphs/Charts | 5 | 10 | 10 |
Number of Variations | 0 | 1 | 1 |
Data Source Connectivity | - | ||
Web Embedding | - | - | - |
Interactive/Animated Visuals | - |
Frequently asked questions
About Faisal
Excel & Google Sheets Expert | Dashboards, Report & Data Visualization
Daska Kalan, Pakistan - 9:23 pm local time
I’m a Data Visualization Expert with 8+ years of experience working with global clients on Fiverr (Level-2), and now bringing my services to Upwork.
I specialize in:
• 📊 Interactive Dashboards in Excel & Google Sheets
• 📈 Data Cleaning, Analysis, and Reporting
• 📅 Automated Monthly Reports
• 📁 KPI Tracking, Business Performance Sheets
My focus is on clarity, accuracy, and aesthetics. You’ll get visuals that not only look great but also communicate your data clearly.
✅ 500+ projects completed On Fiverr
✅ Fast communication & on-time delivery
✅ Confidentiality guaranteed
Let’s bring your data to life. Click “Invite to Job” and let’s talk about your project!
Steps for completing your project
After purchasing the project, send requirements so Faisal can start the project.
Delivery time starts when Faisal receives requirements from you.
Faisal works on your project following the steps below.
Revisions may occur after the delivery date.
Process
1-First draft 2-Final report