You will get a live dashboard built from your spreadsheet, ready to share
Project details
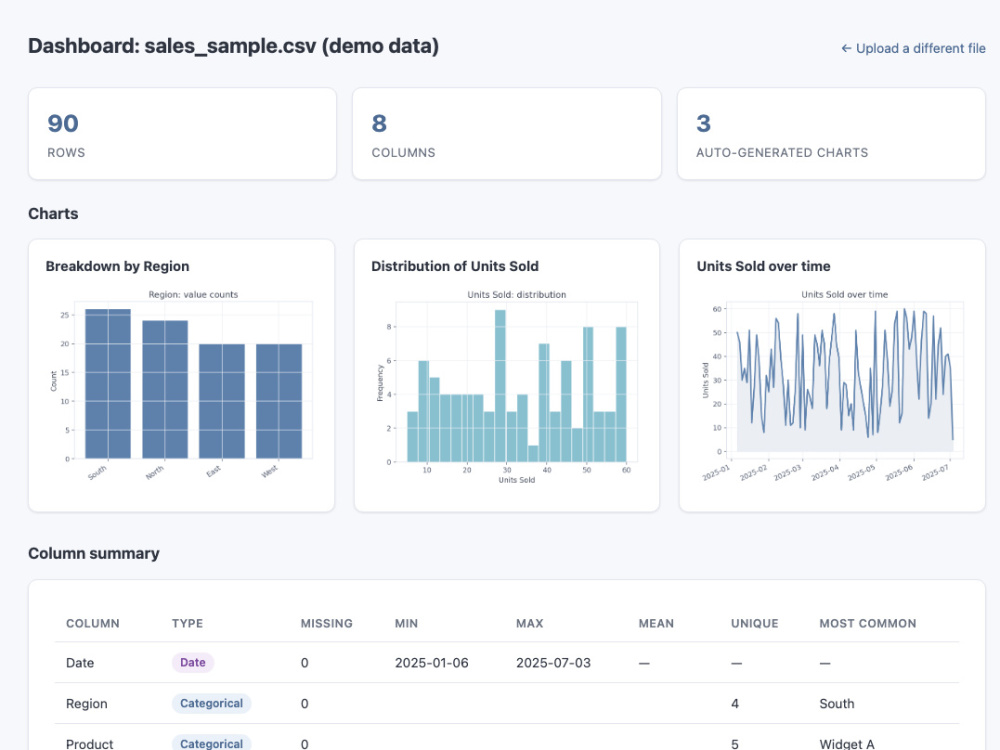
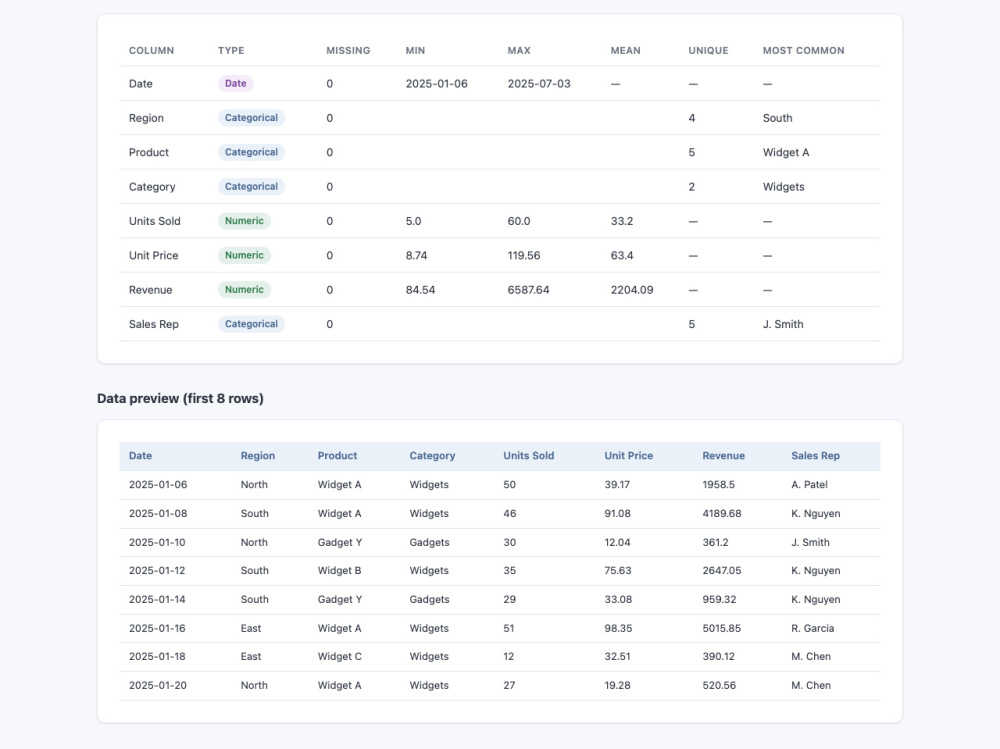
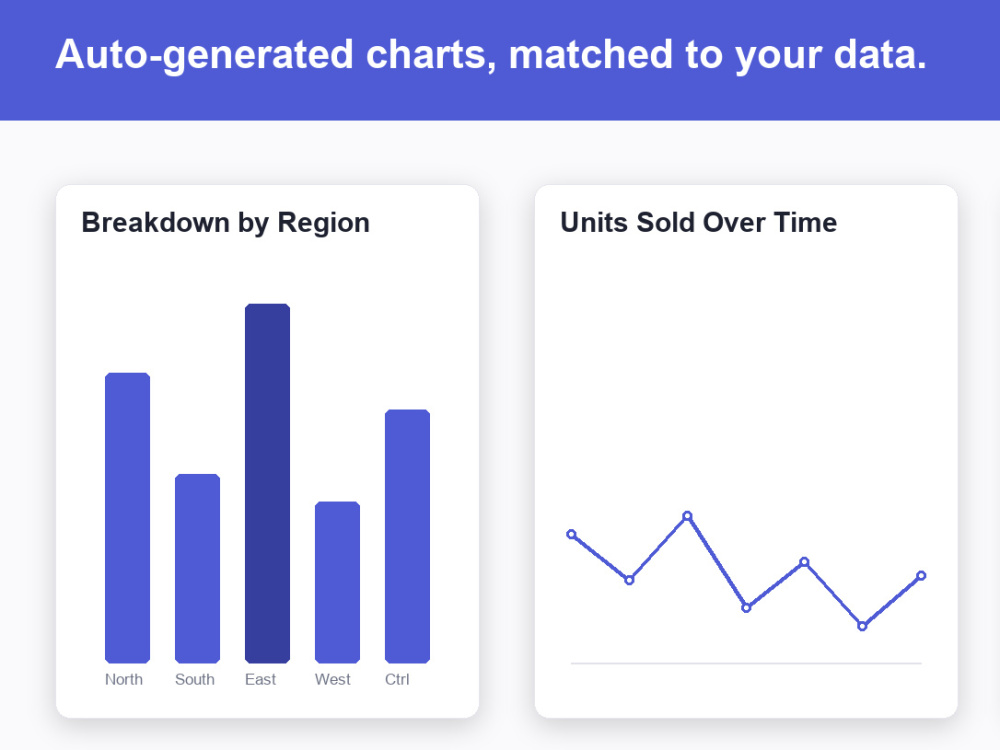
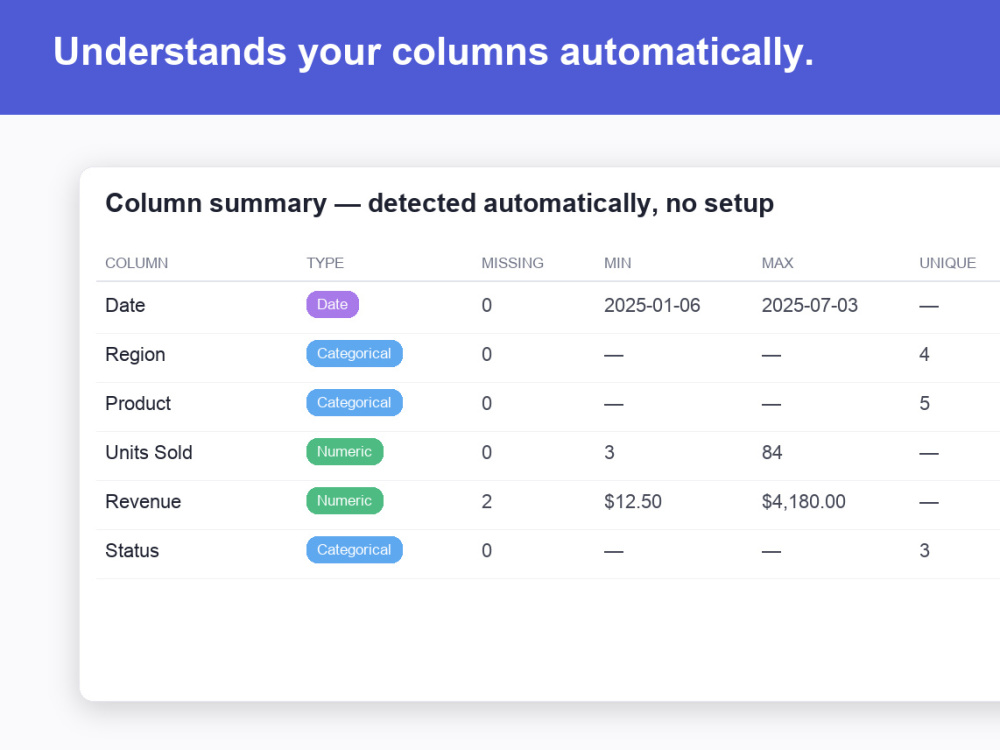
I turn messy spreadsheets into dashboards your team can actually read — upload a CSV and get summary stats and auto-generated charts in seconds, no formulas, no pivot tables, no waiting on someone else to pull the numbers. Built with Python and Flask, styled to look like a real product, not a raw data dump. Higher tiers add custom branding, a shareable deployed link, and a live-connected data source instead of manual uploads.
Programming Languages
PythonWhat's included
| Service Tiers |
Starter
$75
|
Standard
$175
|
Advanced
$350
|
|---|---|---|---|
| Delivery Time | 3 days | 5 days | 7 days |
Number of Revisions | 1 | 2 | 3 |
Number of Pages | 1 | 1 | 2 |
Design Customization | - | ||
Content Upload | |||
Responsive Design | - | - | - |
Source Code |
Optional add-ons
You can add these on the next page.
Fast Delivery
+$30 - $120
Additional Revision
+$25
Additional Page
(+ 2 Days)
+$50Frequently asked questions
About Oliver
Automation & Scripting Developer / Scraper, Dashboards, Extensions
Birmingham, United Kingdom - 7:41 pm local time
Recent projects: a Python tool that monitors market prices and fires alerts on trigger conditions, a dashboard that turns a raw CSV into instant charts and stats, and a chrome extension for capturing and exporting web clips.
If you need something built reliably and explained in plain English, let's talk about your project.
Steps for completing your project
After purchasing the project, send requirements so Oliver can start the project.
Delivery time starts when Oliver receives requirements from you.
Oliver works on your project following the steps below.
Revisions may occur after the delivery date.
Confirm scope against your data
I look at your sample data (or columns) and confirm exactly which stats and charts the dashboard will show before building anything.