You will get a PostgreSQL performance audit and slow query fixes
Rising Talent
Rising Talent
Project details
Your queries used to be fast. Now some pages take seconds, and it is not obvious whether the problem is the query, the index, the schema, or the server config.
I run a production PostgreSQL database myself - an e-commerce price comparison platform with 15.5M rows in the largest table, tuned to stay fast on a modest VPS. This is work I do on my own system, not just for clients.
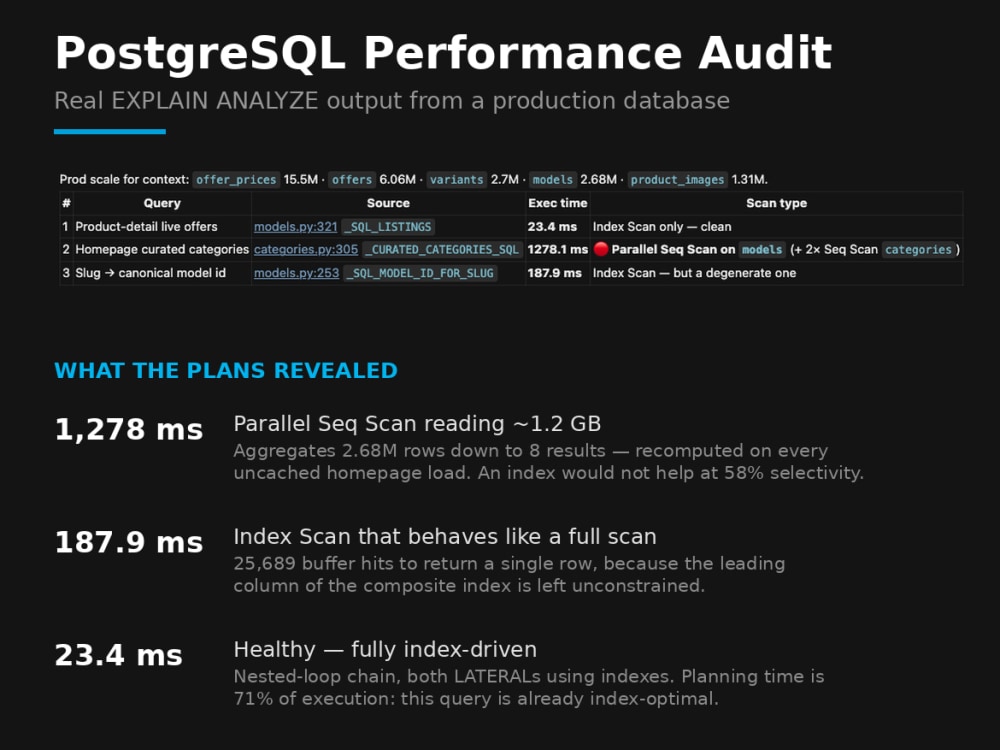
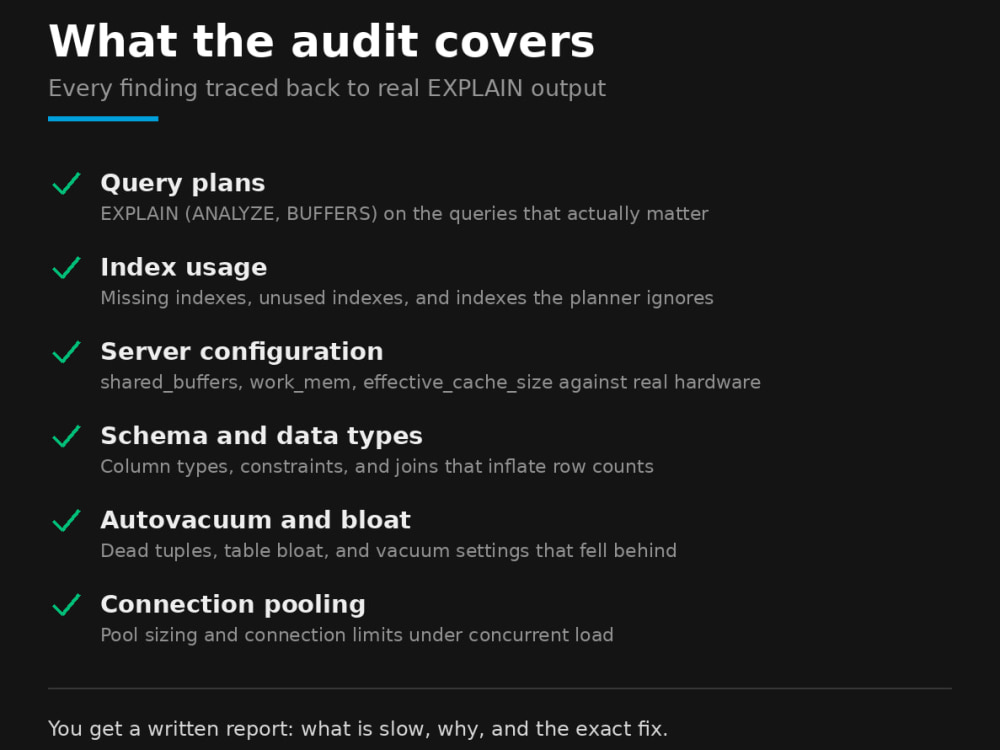
I start with your actual slow queries, not a generic checklist. EXPLAIN (ANALYZE, BUFFERS) shows what the planner is really doing, then I work back to the cause: a missing index, an index the planner ignores, an N+1 pattern hidden behind an ORM, or work_mem left at a default that forces sorts to disk.
What you get is a written report in plain language: what is slow, why, and the exact SQL or config lines to change. Advanced also includes staging changes and before/after benchmark results.
Sometimes the honest answer is that an index will not help. If a filter matches 58% of rows, no btree beats a sequential scan and the planner ignores whatever you create. I will tell you that rather than sell you an index that does nothing.
PostgreSQL only: Supabase, Neon, RDS, self-hosted.
I run a production PostgreSQL database myself - an e-commerce price comparison platform with 15.5M rows in the largest table, tuned to stay fast on a modest VPS. This is work I do on my own system, not just for clients.
I start with your actual slow queries, not a generic checklist. EXPLAIN (ANALYZE, BUFFERS) shows what the planner is really doing, then I work back to the cause: a missing index, an index the planner ignores, an N+1 pattern hidden behind an ORM, or work_mem left at a default that forces sorts to disk.
What you get is a written report in plain language: what is slow, why, and the exact SQL or config lines to change. Advanced also includes staging changes and before/after benchmark results.
Sometimes the honest answer is that an index will not help. If a filter matches 58% of rows, no btree beats a sequential scan and the planner ignores whatever you create. I will tell you that rather than sell you an index that does nothing.
PostgreSQL only: Supabase, Neon, RDS, self-hosted.
Database Type
PostgreSQLWhat's included
| Service Tiers |
Starter
$99
|
Standard
$300
|
Advanced
$600
|
|---|---|---|---|
| Delivery Time | 3 days | 5 days | 10 days |
Number of Revisions | 1 | 2 | 3 |
Source Code | - | - |
Frequently asked questions
About Peerapat
AI Solutions Developer | Automation & RAG for Business Operations
Bangkok, Thailand - 9:48 am local time
I build production-ready AI systems, not one-off demos. This includes RAG knowledge assistants with source citations, AI workflow automation, internal tools, and integrations across messaging platforms, databases, APIs, and business systems.
My focus is reliability: clear permissions, structured and traceable outputs, human handoff where needed, error handling, automated tests, and maintainable code that your team can continue to use after launch.
I can take ownership from discovery and solution design through development, deployment, and ongoing improvement. My core stack includes Python, FastAPI, Next.js, n8n, PostgreSQL, Docker, OpenAI, and Claude.
Typical use cases:
• Internal knowledge assistants that answer from company documents with citations
• AI automation for documents, emails, OCR, forms, approvals, and data processing
• AI integrations for LINE, WhatsApp, Telegram, email, CRM, databases, and internal APIs
• Secure internal tools with user access control and human escalation
If you want to move an AI idea beyond a prototype into a practical system your team can rely on, send me your current workflow and desired outcome.
Steps for completing your project
After purchasing the project, send requirements so Peerapat can start the project.
Delivery time starts when Peerapat receives requirements from you.
Peerapat works on your project following the steps below.
Revisions may occur after the delivery date.
Baseline: capture the current state
I run EXPLAIN (ANALYZE, BUFFERS) on your slow queries and record exact timings, so every improvement later is measured against a real number rather than a claim.
Diagnose: find the real cause
I work back from the query plan to the cause: a missing index, an index the planner ignores, a join inflating row counts, or memory settings forcing sorts to disk.