You will get a Power BI manufacturing and production dashboard
Project details
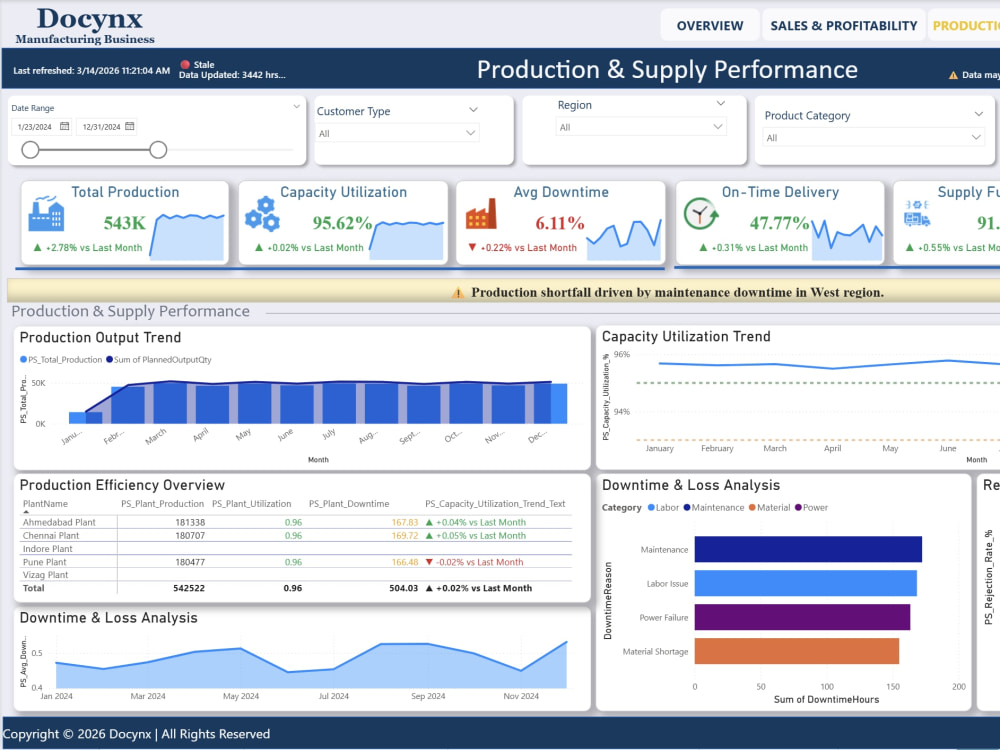
I will design and develop a professional Power BI dashboard for manufacturing, production, operations and supply chain analytics.
I transform raw operational data into interactive dashboards that help businesses monitor production performance, capacity utilization, downtime, supply fulfillment, rejection rates and other critical KPIs.
The dashboard can include interactive filters, KPI cards, trend analysis, plant-level performance, operational comparisons, DAX calculations, Power Query transformations and optimized data models. Incremental Refresh, Role Based Security.
With 4.5+ years of experience in Power BI, SQL and data analytics, I focus on building clean, reliable and easy-to-use dashboards that convert complex operational data into actionable business insights.
I transform raw operational data into interactive dashboards that help businesses monitor production performance, capacity utilization, downtime, supply fulfillment, rejection rates and other critical KPIs.
The dashboard can include interactive filters, KPI cards, trend analysis, plant-level performance, operational comparisons, DAX calculations, Power Query transformations and optimized data models. Incremental Refresh, Role Based Security.
With 4.5+ years of experience in Power BI, SQL and data analytics, I focus on building clean, reliable and easy-to-use dashboards that convert complex operational data into actionable business insights.
Data Tool
Microsoft Power BIWhat's included
| Service Tiers |
Starter
$189
|
Standard
$479
|
Advanced
$949
|
|---|---|---|---|
| Delivery Time | 7 days | 14 days | 28 days |
Number of Revisions | 2 | 4 | 6 |
Number of Graphs/Charts | 8 | 20 | 40 |
Number of Variations | 1 | 1 | 1 |
Data Source Connectivity | |||
Web Embedding | - | ||
Interactive/Animated Visuals |
Optional add-ons
You can add these on the next page.
Fast Delivery
+$99 - $299
Web Embedding
(+ 1 Day)
+$49Frequently asked questions
About Vaibhav
Power BI Developer | Microsoft Fabric | Dashboard Expert | DAX | SQL
Amravati, India - 7:53 pm local time
My expertise includes Power BI, Microsoft Fabric, SQL, DAX, Power Query, ETL, Data Modeling, Power BI Service, Row-Level Security (RLS), Incremental Refresh, Deployment Pipelines, KPI Reporting, and Report Performance Optimisation. I also have experience developing predictive analytics and machine learning workflows using RapidMiner.
I have delivered reporting solutions for the petrochemical industry, developing dashboards for CGC, DeEthanizer, Ethylene Glycol (EG), CO₂, Cold Section, Furnace Operations, Plant Efficiency, and Equipment Performance. My work includes integrating data from SQL Server, PI Server, Excel, and enterprise systems into centralized reporting platforms.
I can help you with:
• Interactive Power BI Dashboards
• Executive & KPI Dashboards
• DAX Measures & Data Modeling
• SQL Queries & ETL
• Power Query Data Transformation
• Report Optimization & Troubleshooting
• Predictive Analytics with RapidMiner
I focus on delivering clean, scalable, and business-friendly solutions with clear communication, timely delivery, and high-quality results. If you're looking for a reliable Power BI developer to turn your data into meaningful insights, I'd be happy to help.
Steps for completing your project
After purchasing the project, send requirements so Vaibhav can start the project.
Delivery time starts when Vaibhav receives requirements from you.
Vaibhav works on your project following the steps below.
Revisions may occur after the delivery date.
Requirement & KPI Analysis
Review business objectives, datasets, KPIs and reporting requirements.
Data Preparation
Clean, transform and prepare the data using Power Query and required ETL processes.