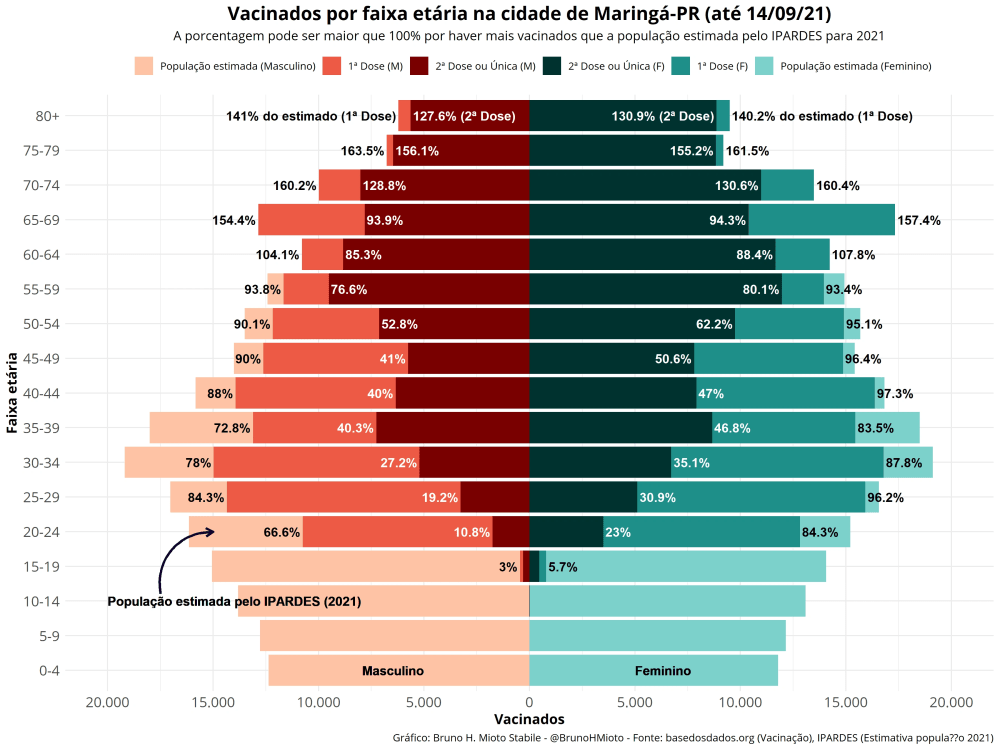
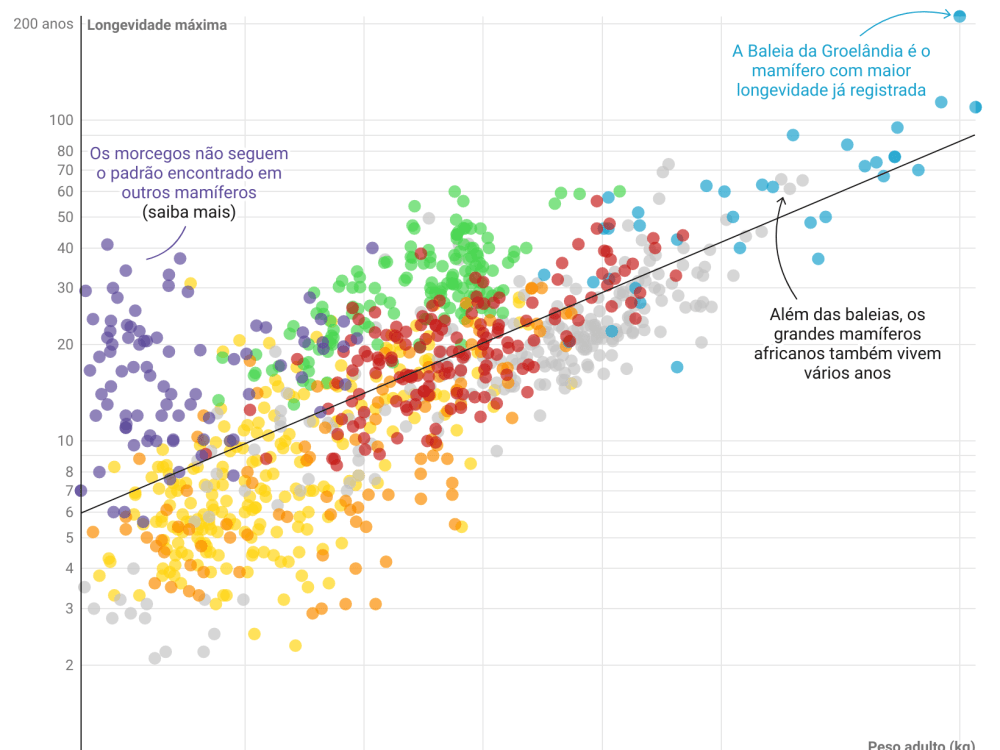
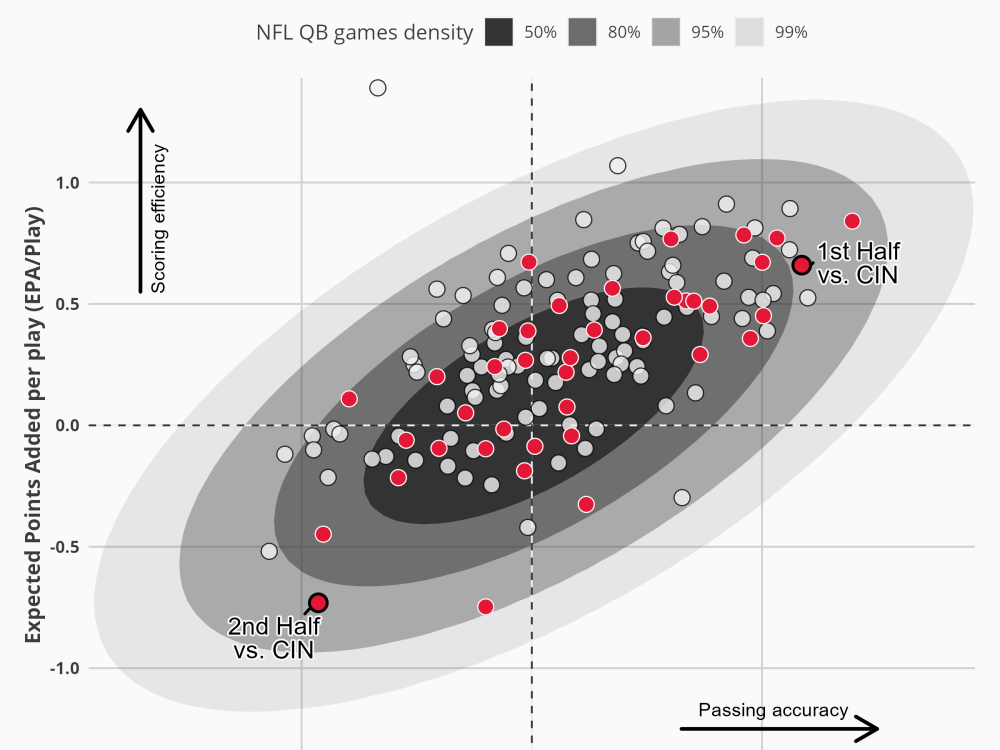
You will get a professional data visualization for your data - ggplot2 - R
Rising Talent


Project details
Custom visualization from your data!
You can:
- Choose the chart type (e.g. line chart, bar chart, point chart, or any other you want)
- Select the colors (or color palette) used in charts
- Send your custom logo
For creating the charts, a raw excel file with data is necessary.
You can:
- Choose the chart type (e.g. line chart, bar chart, point chart, or any other you want)
- Select the colors (or color palette) used in charts
- Send your custom logo
For creating the charts, a raw excel file with data is necessary.
Data Tool
RWhat's included $50
These options are included with the project scope.
$50
- Delivery Time 7 days
- Number of Revisions 3
- Number of Graphs/Charts 1
- Number of Variations 1
Frequently asked questions
52 reviews
(52)
(0)
(0)
(0)
(0)
TB
Teen B.
Jul 25, 2024
Bruno was able to transform my VERY large data set and complicated instructions into exactly the visualization I was looking for. He is skilled in R and is communicative, proactive, and professional. I would highly recommend him!
HW
Helen W.
Dec 28, 2022
Bruno made perfect maps that are nested across years. I can’t think of anyone I’d rather have give expert advice on this type of work than him --- much appreciated!
HW
Helen W.
Nov 16, 2022
Bruno created the exact diagram I wanted through R. Superb talent!
HW
Helen W.
Nov 4, 2022
Made another set of excellent figures to make my research project perfect!
HW
Helen W.
Oct 15, 2022
NH
Nick H.
Sep 29, 2025
Suggest an alternative visualization design for scientific paper
ZG
Zydrelle G.
Feb 26, 2025
30 minute consultation
MC
Mary C.
Sep 20, 2024
write a script for a plot in R
MC
Mary C.
Sep 20, 2024
Writing script in R
TB
Teen B.
Jul 25, 2024
You will get a professional data visualization for your data - ggplot2 - R
Bruno was able to transform my VERY large data set and complicated instructions into exactly the visualization I was looking for. He is skilled in R and is communicative, proactive, and professional. I would highly recommend him!
About Bruno
Data Visualization - Business and Scientific Charts
100%
Job Success
Maringa, Brazil - 9:08 pm local time
As a Data Analyst and Scientist, I work with a lot of data and communicate through charts in scientific papers or presentations.
I have experience with R language and chart creation with ggplot package.
I make charts from excel and other sources from the users.
You can choose the chart type, the colors you like, and any other thing!
Use the charts wherever you want (e.g. presentations, PowerPoint, etc)
Steps for completing your project
After purchasing the project, send requirements so Bruno can start the project.
Delivery time starts when Bruno receives requirements from you.
Bruno works on your project following the steps below.
Revisions may occur after the delivery date.
Receive data from client
Create a chart