You will get an interactive custom web dashboard using Tailwind CSS and Chart.js
Project details
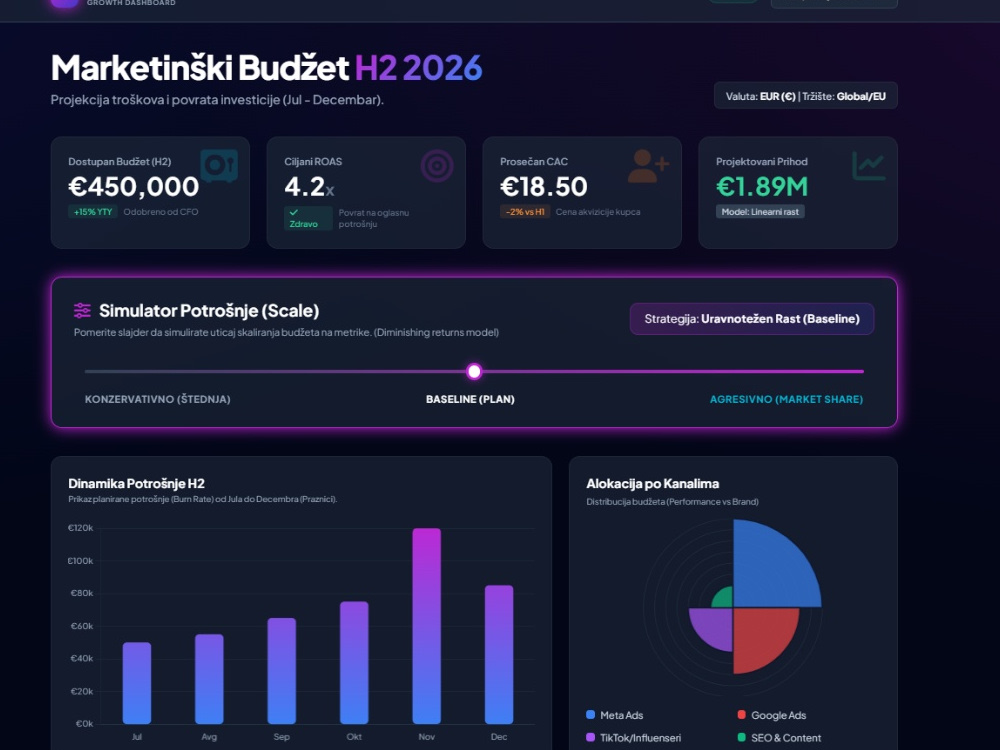
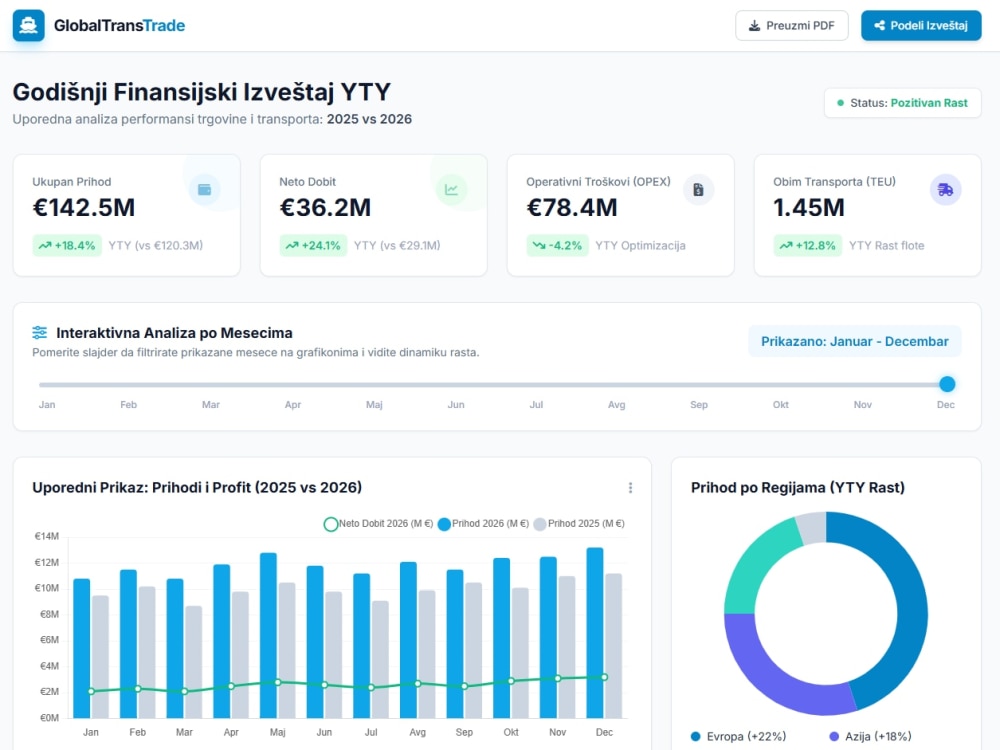
Are you looking for a premium, modern way to showcase your business metrics? Static spreadsheets and ugly backend interfaces don't win investors or help you make quick decisions.
I build high-end, responsive, and interactive frontend dashboards that bring your data to life.
What this Project Catalog includes:
• Clean & Semantic Architecture: Built using HTML5, CSS3, and JavaScript (ES6+).
• Modern Styling: Tailored with Tailwind CSS for a sleek, corporate look (Dark mode or Light mode available).
• Dynamic Data Visualization: Implementation of Chart.js for smooth, animated graphs (Bar, Line, Doughnut, Radar) that update in real-time.
• Executive Features: Custom time-range or metric sliders to let users filter data seamlessly on the fly.
• Mobile-First Design: Fully responsive layouts that look stunning on desktops, iPads, and smartphones.
Please Note: This project covers the complete frontend UI/UX and interactivity. The code will be delivered with clear comments, making it incredibly easy for your backend developers to hook it up to your live API or database.
I build high-end, responsive, and interactive frontend dashboards that bring your data to life.
What this Project Catalog includes:
• Clean & Semantic Architecture: Built using HTML5, CSS3, and JavaScript (ES6+).
• Modern Styling: Tailored with Tailwind CSS for a sleek, corporate look (Dark mode or Light mode available).
• Dynamic Data Visualization: Implementation of Chart.js for smooth, animated graphs (Bar, Line, Doughnut, Radar) that update in real-time.
• Executive Features: Custom time-range or metric sliders to let users filter data seamlessly on the fly.
• Mobile-First Design: Fully responsive layouts that look stunning on desktops, iPads, and smartphones.
Please Note: This project covers the complete frontend UI/UX and interactivity. The code will be delivered with clear comments, making it incredibly easy for your backend developers to hook it up to your live API or database.
Programming Languages
HTML & CSS, JavaScript, TypeScriptCoding Expertise
Cross Browser & Device Compatibility, Performance OptimizationWhat's included
| Service Tiers |
Starter
$50
|
Standard
$130
|
Advanced
$280
|
|---|---|---|---|
| Delivery Time | 2 days | 3 days | 5 days |
Number of Revisions | 2 | 3 | Unlimited |
Number of Pages | 1 | 2 | 4 |
Design Customization | |||
Content Upload | - | ||
Responsive Design | |||
Source Code |
About Stefan
Frontend Developer | Data Visualization & Custom Analytics Dashboards
Belgrade, Serbia - 3:47 pm local time
I help businesses, SaaS startups, and marketing agencies turn raw data into stunning, interactive, and responsive web dashboards that drive decisions and impress stakeholders.
Many developers can write code, but very few understand how to translate business metrics into clean, intuitive user experiences (UI/UX). I bridge that gap using modern web technologies like Tailwind CSS and Chart.js.
🚀 WHAT I CAN BUILD FOR YOU:
Custom Analytics & Financial Dashboards (Year-over-Year, Budgeting, ROI)
Interactive Charts & Graphs (Line, Bar, Radar, Polar charts with real-time updates)
SaaS Admin Panels & User Portals
Crisis & Logistics Dashboards (focusing on alerts, leaks, and cost-cutting metrics)
Fully responsive "Mobile-First" interfaces for executives on the go
💻 MY TECH STACK:
Frontend: HTML5, CSS3, JavaScript (ES6+)
Styling: Tailwind CSS (Clean, utility-first, custom themes)
Data Vis: Chart.js, SVG Custom Graphics
🌟 WHY WORK WITH ME?
Business-Driven Design: I focus on KPIs that matter to your industry (ROAS, CAC, Retention, OPEX).
"Clean Code" Guarantee: Well-commented, semantic, and easy to integrate with your backend APIs.
Instant Interactive Demos: You will get a live link (Netlify/Vercel) to play with the interactive UI before I deliver the final files.
Clear & Proactive Communication: Daily updates and quick turnaround times.
Let’s turn your data into a powerful business asset.
Click the "Invite to Job" button, and let's discuss your project!
Steps for completing your project
After purchasing the project, send requirements so Stefan can start the project.
Delivery time starts when Stefan receives requirements from you.
Stefan works on your project following the steps below.
Revisions may occur after the delivery date.
Requirement Analysis & UI Design Review
Reviewing client requirements, brand colors, and finalizing the layout structure and charts to be implemented.
Frontend Development & Interactivity
Coding the dashboard using Tailwind CSS and integrating Chart.js for responsive, animated graphs.