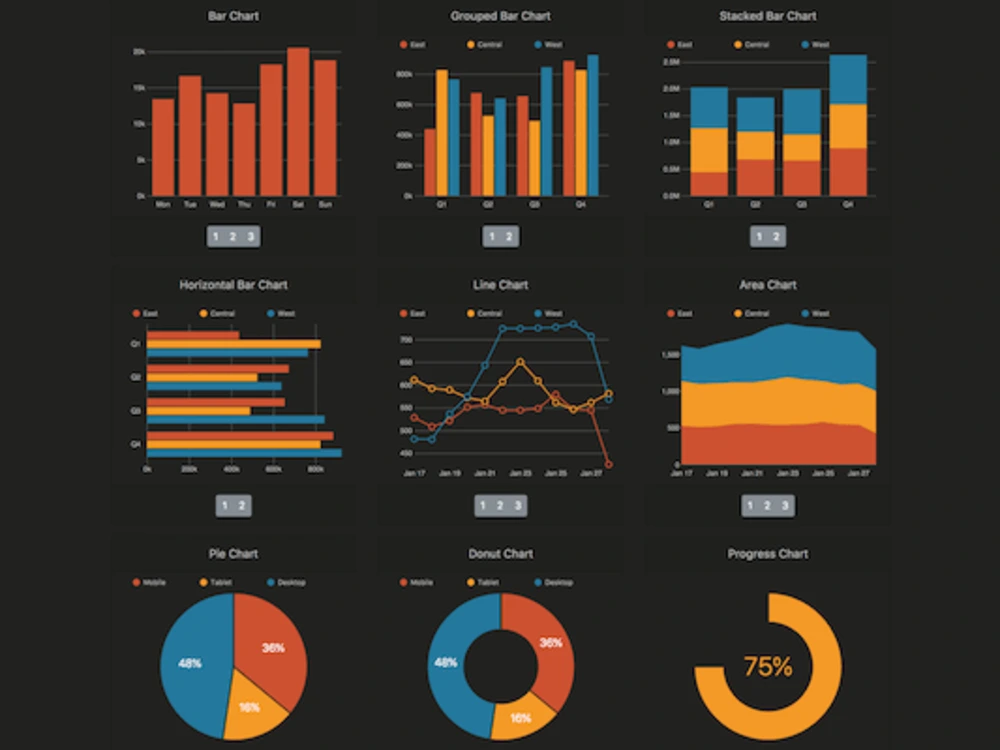
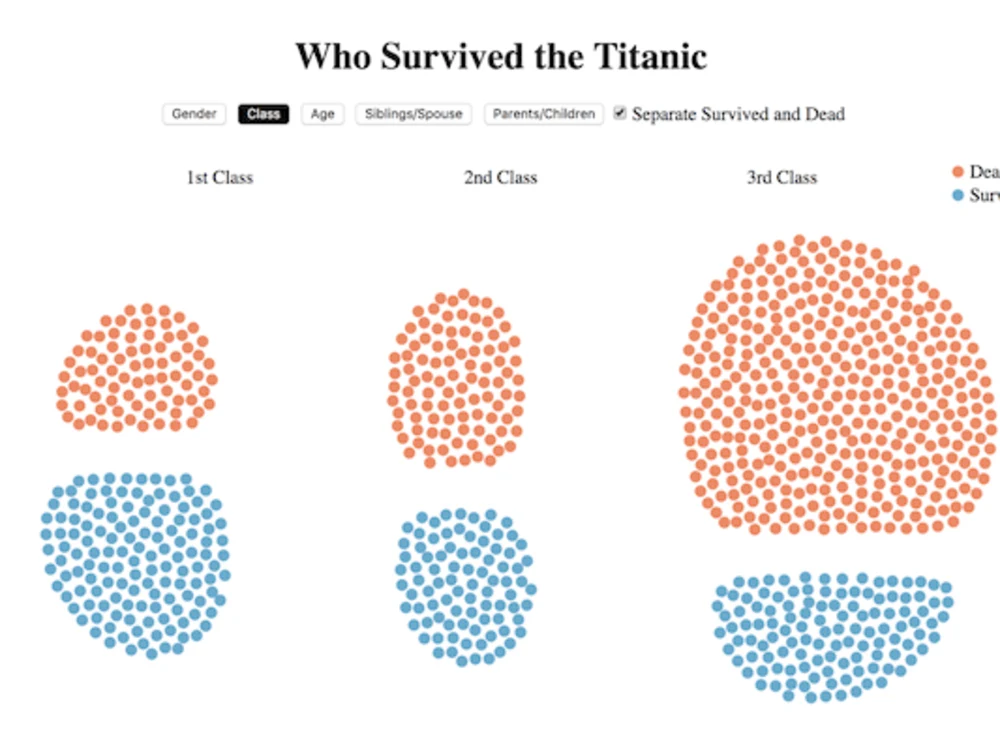
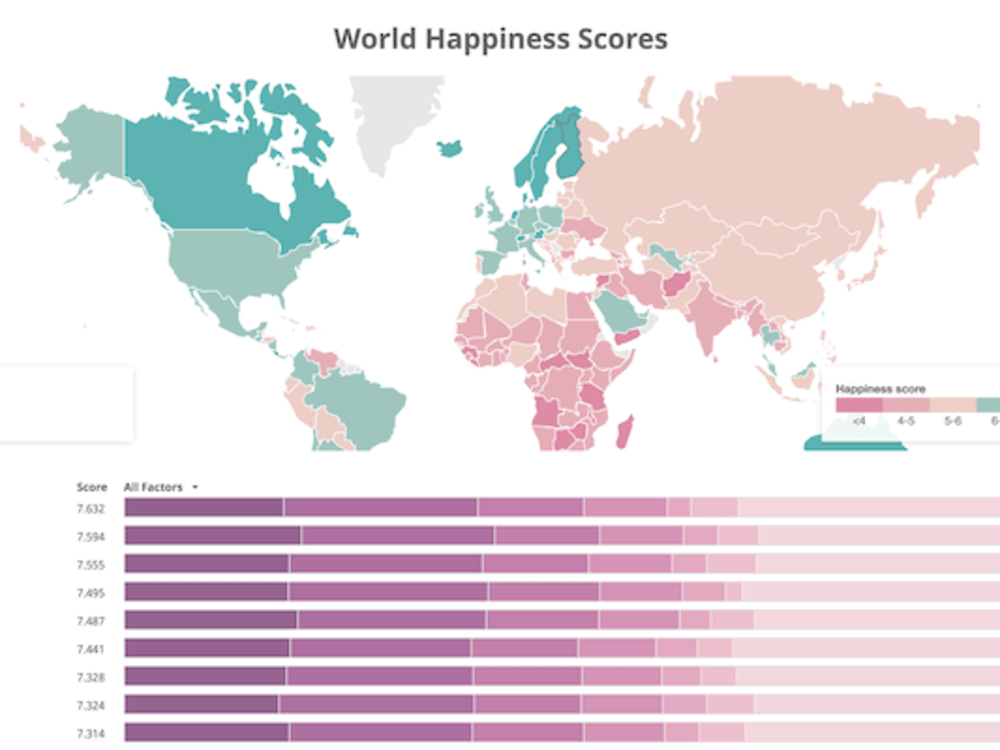
You will get an interactive web based data visualization
Top Rated


Top Rated
Project details
I was a physicist who stumbled upon data visualization and fell in love with the transformation of hard-to-understand data into engaging and insightful charts/graphs. I deliver my work in standard web technology (html/css/javascript).
Programming Languages
JavaScriptWhat's included
| Service Tiers |
Starter
$50
|
Standard
$100
|
Advanced
$150
|
|---|---|---|---|
| Delivery Time | 3 days | 5 days | 7 days |
Number of Revisions | 1 | 1 | 2 |
Design Customization | - | - | |
Content Upload | - | - | - |
Responsive Design | - | ||
Source Code |
Frequently asked questions
103 reviews
(103)
(0)
(0)
(0)
(0)
AB
Andy B.
Sep 17, 2024
we are very happy with the work. Fast and professional.
AB
Andy B.
Sep 17, 2024
Very professional and fast!
TO
Tim O.
Feb 9, 2023
Zhenmao was incredibly timely with delivery, very easy to work with, and the end result was terrific. Highly recommend!
JM
Jacob M.
Dec 29, 2025
D3.js Visualizations Updated Live on Website
Zhenmao has excellent data visualization skills. He understood the job well and knew which types of data visualization would best tell the story from the data. If I need more data visualization help, Zhenmao is who I am going to contact.
GA
Geordie A.
Dec 19, 2025
Charting and Website Visualization Expertise
HG
Harrison G.
Nov 10, 2025
Data visualization for a presentation
PB
Predrag B.
Mar 25, 2025
Help with visx based chart in React
Perfect project! Zhenmao quickly understood the requirements, asked the right questions and then simply came back with results. Highly recommend Zhenmao, will hire again!
LL
Lorenzo L.
Mar 4, 2025
D3.js Node Graph
About Zhenmao
Build your interactive data visualization with d3.js and beyond
100%
Job Success
Chongqing, China - 12:18 pm local time
If you only have data, I can assist you to choose the right chart type and design the layout to highlight the insight.
If you have a mockup, I can help you improve upon it and develop it according to your specification.
If you have a chart already, I can help redesign and improve the chart with more appealing aesthetics and more engaging user interactions.
If you have any other requests, no matter it is a static figure or an interactive webpage, I am happy to discuss your project details with you.
I am good at working with different people and in settings. I taught college students physics, I worked in various research groups, and I also consulted private businesses.
I am looking forward to working with reliable and trustworthy clients just like you.
Steps for completing your project
After purchasing the project, send requirements so Zhenmao can start the project.
Delivery time starts when Zhenmao receives requirements from you.
Zhenmao works on your project following the steps below.
Revisions may occur after the delivery date.
1. Requirements gathering and project discussion
You provide a list of requirements. We discuss the details of the project and agree on the delivery.
First draft delivering and feedback gathering
I deliver the first draft within the agreed-upon timeline. You provide feedback after reviewing the first draft.