You will get automate your data cleaning and analysis with Python
Project details
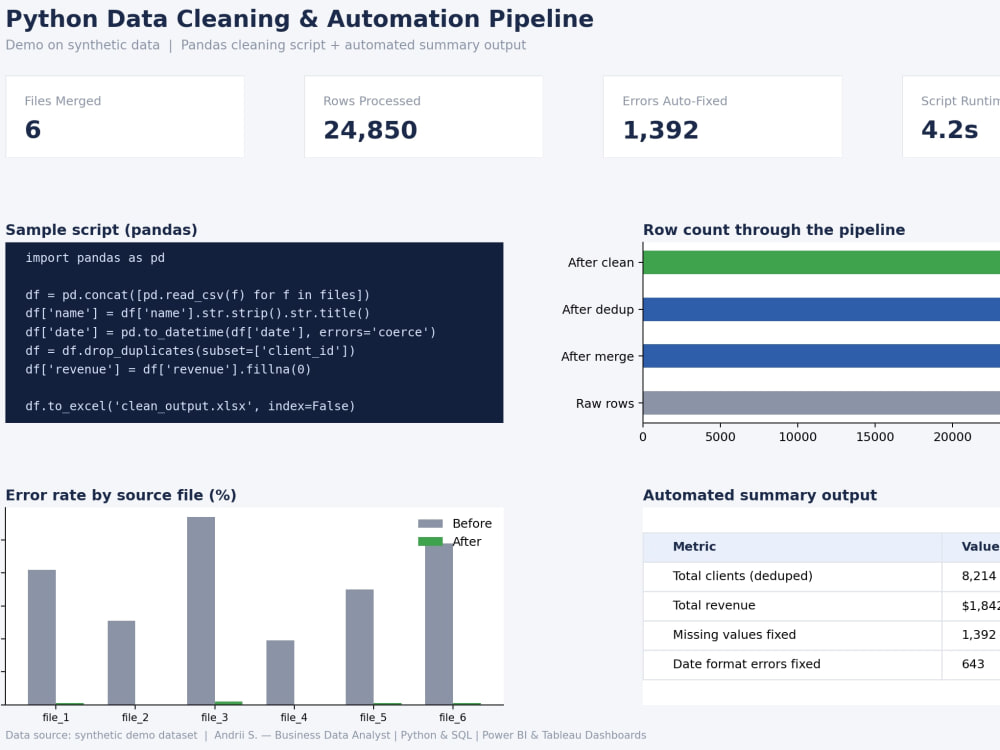
I help businesses turn messy, scattered data into clean, reliable output using Python. With 7 years in banking and finance handling transactional data, plus hands-on Python and Pandas experience, I write scripts that clean, merge, and structure your data - so you are not doing it by hand in Excel every time.
I start by reviewing your files and confirming exactly what the script needs to do before writing any code, so the final result matches what you actually need.
This works well for small business owners, startups, and teams who deal with messy spreadsheets, multiple data sources, or repetitive manual cleanup and want it automated.
Message me with a sample of your data and what the clean output should look like, and I will confirm scope before you order.
I start by reviewing your files and confirming exactly what the script needs to do before writing any code, so the final result matches what you actually need.
This works well for small business owners, startups, and teams who deal with messy spreadsheets, multiple data sources, or repetitive manual cleanup and want it automated.
Message me with a sample of your data and what the clean output should look like, and I will confirm scope before you order.
Data Tool
PythonWhat's included
| Service Tiers |
Starter
$120
|
Standard
$250
|
Advanced
$480
|
|---|---|---|---|
| Delivery Time | 3 days | 5 days | 7 days |
Number of Revisions | 0 | 0 | 0 |
Number of Pages Mined/Scraped | 10 | 30 | 100 |
Number of Sources Mined/Scraped | 1 | 3 | 10 |
Frequently asked questions
About Andrii
Business Data Analyst | Python & SQL | Power BI & Tableau Dashboards
Dublin, Ireland - 1:06 am local time
What that combination means for you in practice:
I handle the full cycle myself: cleaning and structuring raw data with Python/SQL, then building it into a Power BI or Tableau dashboard — no handoffs between a "data person" and a "dashboard person." Before I start building, I clarify what decisions the dashboard needs to support, so you get something your team actually uses, not just a technically impressive chart.
Recent project example: I built an interactive Tableau dashboard analyzing 144M+ streaming views, using dynamic parameters and period-based filtering to surface audience retention trends.
I'm currently completing a Level 7 diploma in Data Analytics for Business at CCT College Dublin (Python, statistics, ML fundamentals), which keeps my technical skills current alongside my finance background.
Let's talk about your project — I'm happy to share a draft dashboard structure before starting full development, so we're aligned early.
Steps for completing your project
After purchasing the project, send requirements so Andrii can start the project.
Delivery time starts when Andrii receives requirements from you.
Andrii works on your project following the steps below.
Revisions may occur after the delivery date.
Review data & confirm scope
I check your files and confirm what cleaning or automation logic you need.
Write & test the Python script
I build the Pandas script to clean, merge, and structure your data.