You will get Super Amazing Tableau Dashboard
Project details
Why Choose Me?
With 4 years of experience in data management and presentation within both consulting and corporate environments, I offer a deep understanding of how to effectively handle and present data. As an expert in Power BI, I specialize in creating dynamic dashboards that provide consistent and reliable insights for your business needs. Power BI stands out as a leading tool in the Data Visualization & Analytics sphere, offering monthly updates with cutting-edge visuals and robust capabilities for data transformation and analysis.
What Can I Offer?
DAX expertise for column and measure refinement
Automated Extract-Transform-Load (ETL) processes to streamline data integration
Creation and organization of cohesive Entity/Relationships Data Models for visualization
Customized reports and professional dashboards tailored to your requirements
Stunning visualizations including tables, charts, graphs, maps, and networks
Implementation of dynamic filters for interactive user experiences
Plus, much more!
Thank you for considering me. I look forward to collaborating with you to enhance your data strategy and drive actionable insights. Best regards!
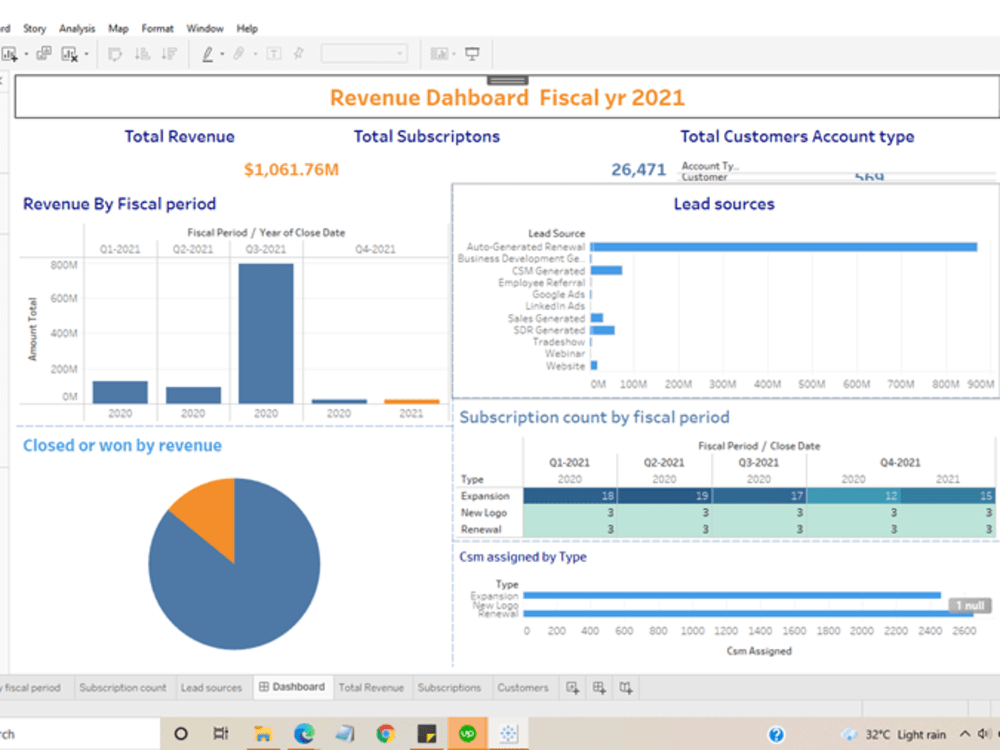
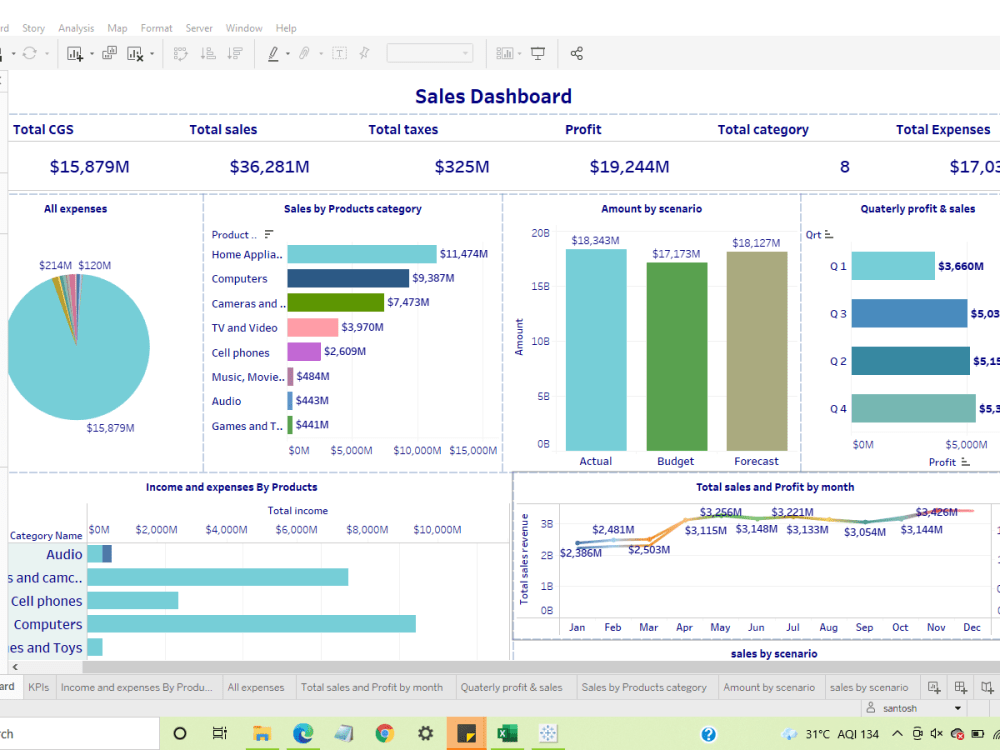
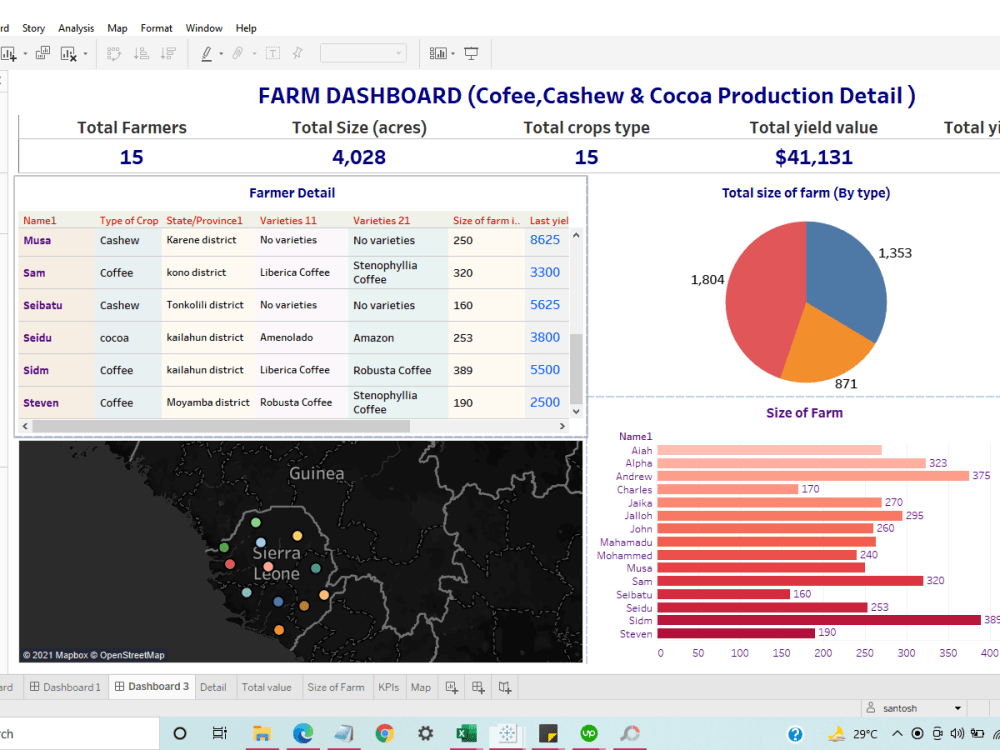
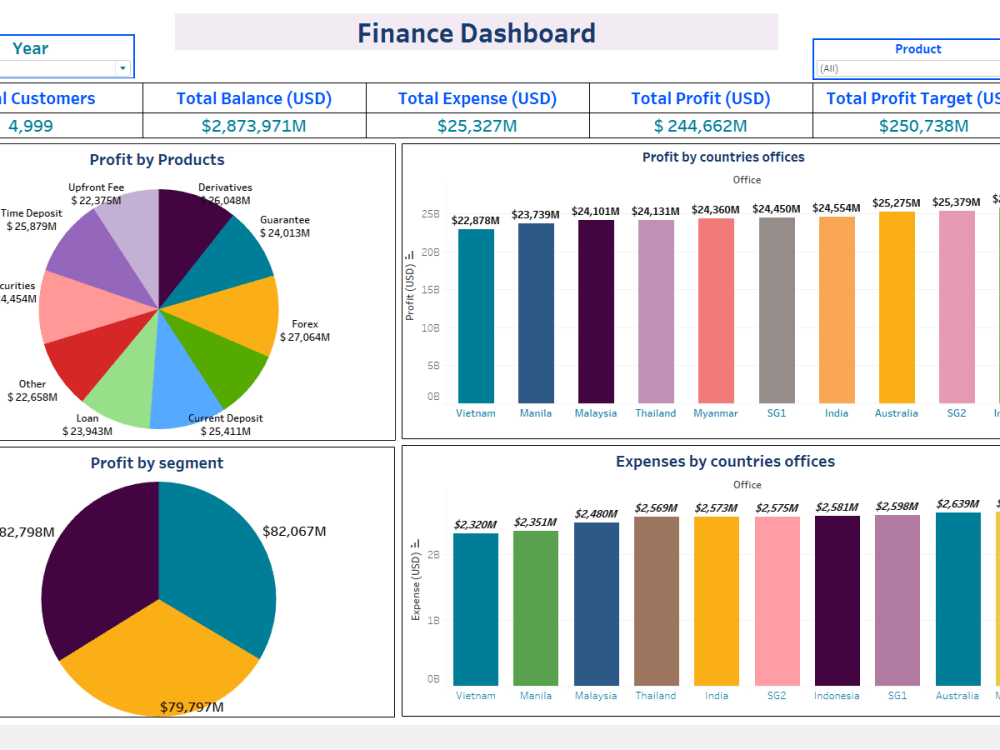
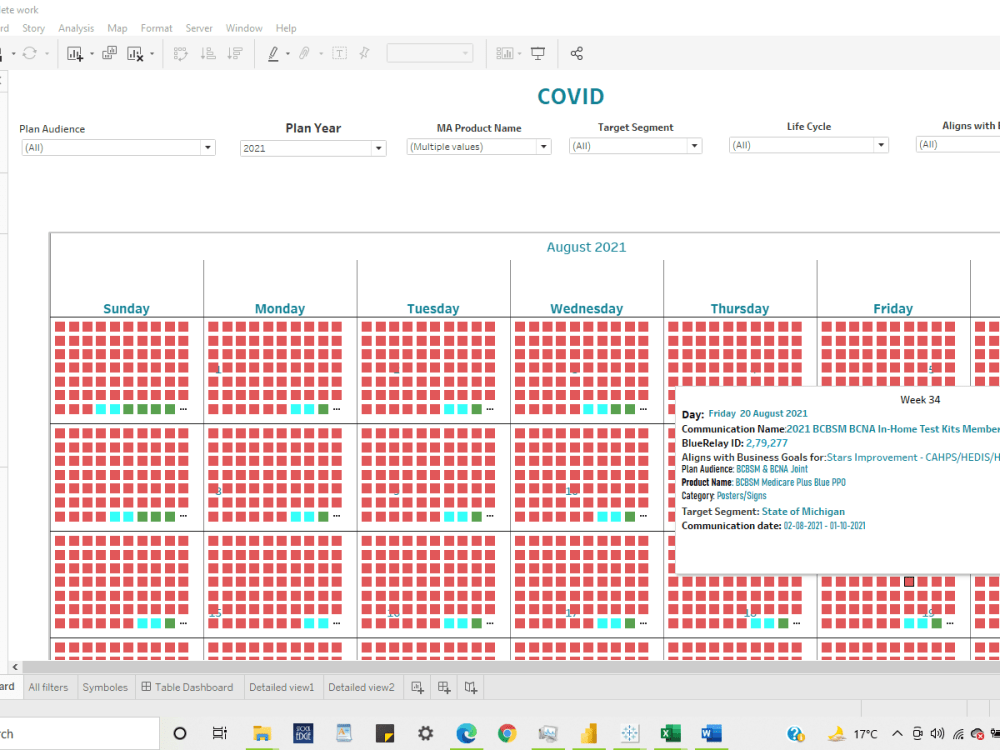
Data Tool
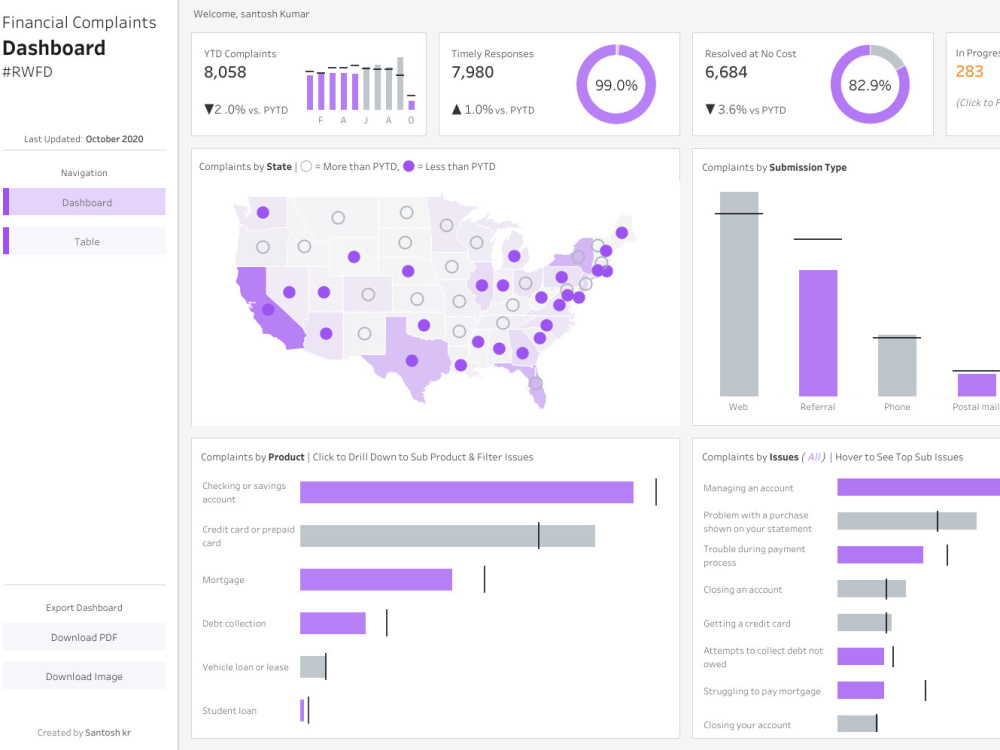
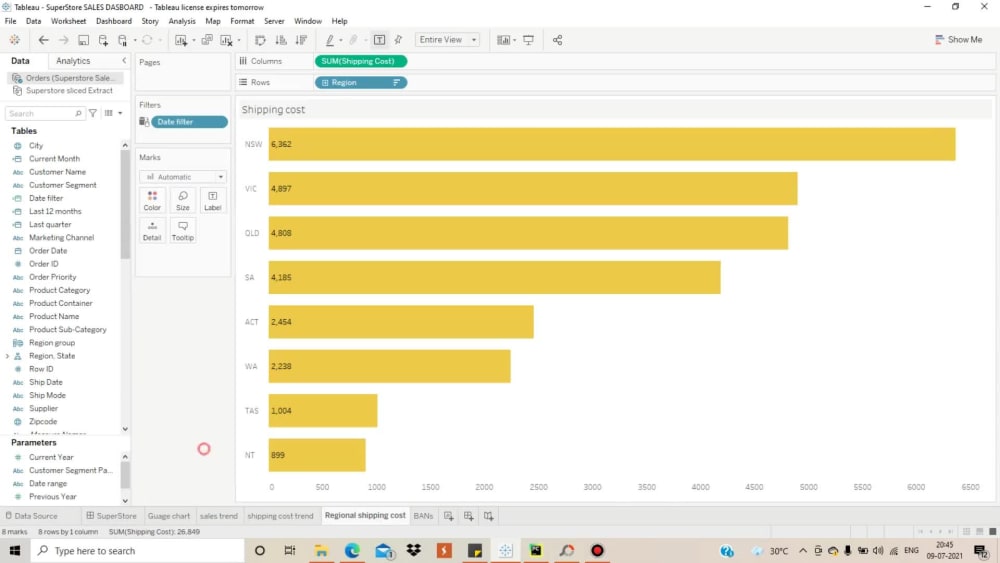
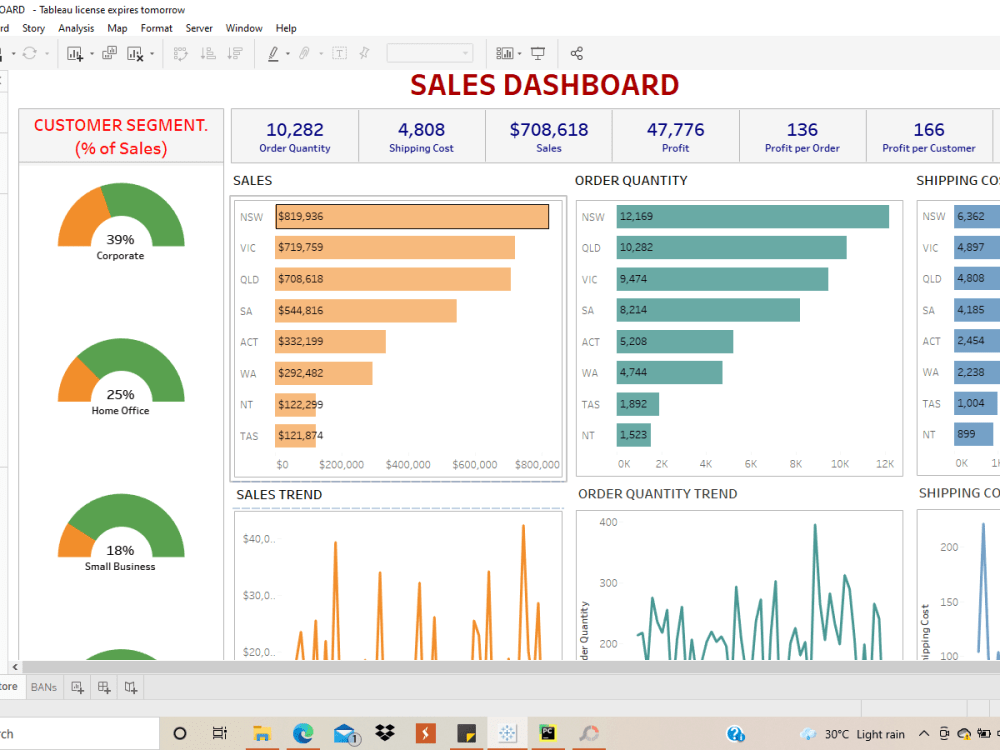
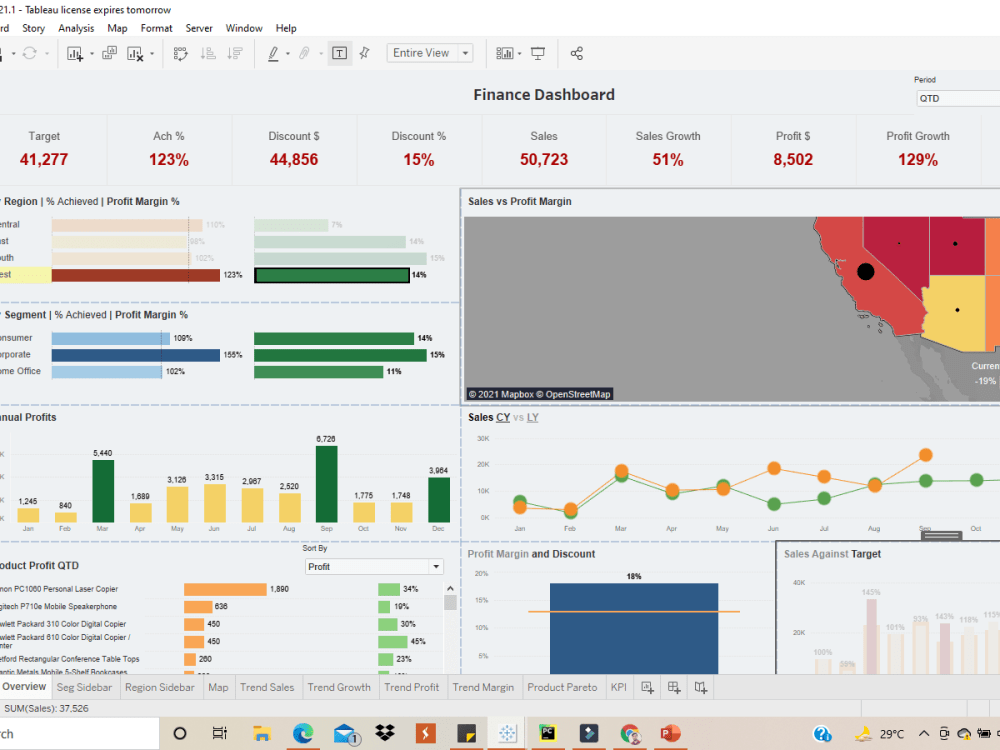
TableauWhat's included
| Service Tiers |
Starter
$50
|
Standard
$100
|
Advanced
$200
|
|---|---|---|---|
| Delivery Time | 3 days | 2 days | 3 days |
Number of Revisions | 1 | 2 | 4 |
Number of Graphs/Charts | 3 | 5 | 10 |
Number of Variations | 1 | 2 | 4 |
Data Source Connectivity | |||
Web Embedding | - | ||
Interactive/Animated Visuals | - | - |
Frequently asked questions
33 reviews
(22)
(7)
(2)
(1)
(1)
WF
Wee Horng F.
Jan 25, 2022
NS
Naidu S.
Sep 3, 2025
Azure data factory - Pipelines
OA
Omar A.
Apr 16, 2025
Tableau Expert
FT
Falguni T.
Mar 27, 2025
Data engineer with azure synapse
RA
Robert A.
Dec 14, 2024
Power Bi Report Development for Quality Management Module
ST
Surya T.
Aug 5, 2022
Need to create 10 visualizations and dashboard using Tableau
I enjoyed working with Santosh. He is really amazing to work with and very knowledgeable in Tableau & Analytics.
Provided great design and Dynamic dashboard, which was beyond my expectation. Thank you Santosh, look forward to working with you again in near future.
Provided great design and Dynamic dashboard, which was beyond my expectation. Thank you Santosh, look forward to working with you again in near future.
About Santosh
Azure Data engineer |ADF |GCP|Databricks|Snowflake
80%
Job Success
Jamalpur, India - 1:17 pm local time
I can unlock the power of your data by building great and interactive dashboards and engaging reports that inspire smarter business decisions.
My dashboards will transform your raw data into the metrics and dimensions needed to create easy-to-understand reports and dashboards by SME’s and Leaders.
I am an advanced data visualization practitioner in reporting, business intelligence, KPIs, data cleansing, data modelling, data transformation and business development.
SKILLS:
☁️ Cloud: Azure DATA FACTORY,AWS,Google Cloud,DATABRICKS,Azure Devops CI&CD PIPELINES
👨 Databases: SQL Server, PostgreSQL, MySQL, MONGO DB
⚙️ Data Integration/ETL: SSIS ,ALTERYX
⚙️ MSBI TOOLS: Power Automate, Power APPS
💻 Visualization: PowerBI,Tableau,Tableau Prep,Power QUERY,SSRS,Qlikview, Qliksense,Klipfolio,Google Data studio, Looker and EXCEL
🔑 Scripting - Python for API Integrations and Data Processing
FIGMA-UI & UX design
Industries we have worked in:
⭐ Manufacturing
⭐ Marketing
⭐ Financial (Investment and management)
⭐ Healthcare
⭐ Retail (Ecommerce and Physical)
⭐ Consulting
⭐ Education
⭐ Customer Behavior/Insights
⭐ Automotive
⭐ Legal Services
⭐ Film Production
Working with companies located in:
🌎 United States (PST to EST, GMT -8 to GMT -5)
🌎 United Kingdom (GMT)
🌎 Spain (CET, GMT +1)
🌎 Netherlands (CET, GMT +1)
🌎 Israel (IST, GMT+2)
🌎 Australia (ACT, GMT + 11)
I have a great experience with the following project categories:
1) Data Analytics
2) UI & UX Design Figma/Adobe Xd
3) Data Extraction, Data Mining
4) Data Engineering
5) Anything with data
6) Map visualization
7) Python Exploratory data analysis
8) Predictive analysis, and forecasting.
Thanks, Regards
Santosh Kr
Top Rated PLus
Steps for completing your project
After purchasing the project, send requirements so Santosh can start the project.
Delivery time starts when Santosh receives requirements from you.
Santosh works on your project following the steps below.
Revisions may occur after the delivery date.
Purchase the project as per your requirement
Hey, you can order as per your requirement,If your requirement not available here then just inbox me for more detail.
After starting project stay connected for requirements
Hey, you have to provide all the details to start work as soon as possible .thanks