You will get clean, analyzed Excel or CSV data for visualization
Project details
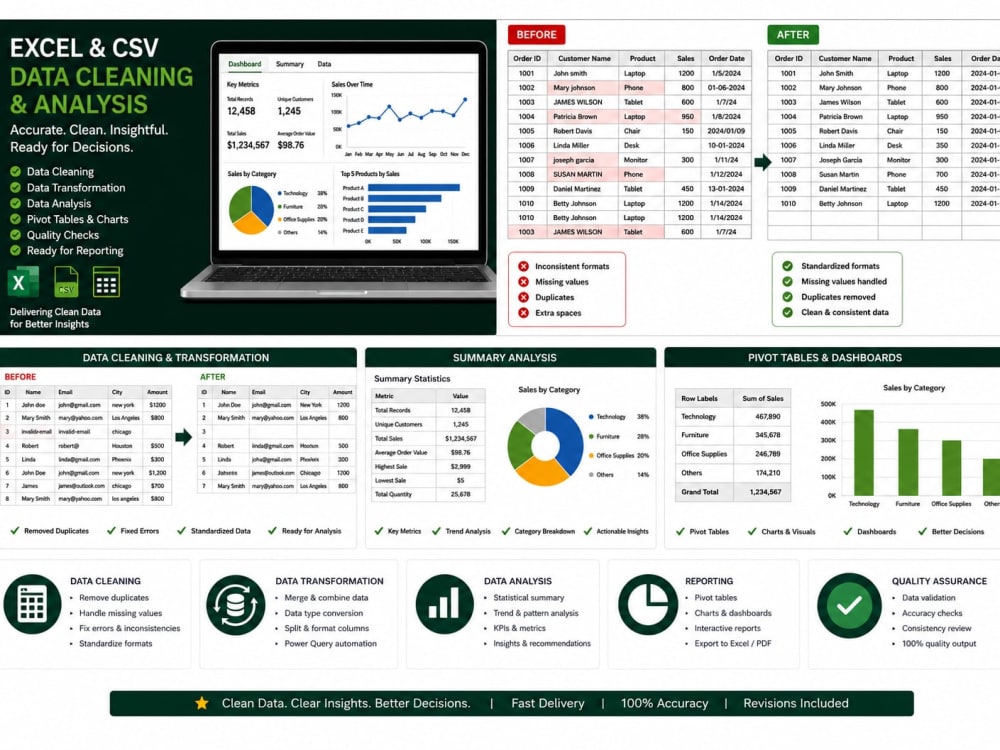
You will receive clean, accurate, and analysis-ready Excel or CSV data tailored to your business needs. I will clean, organize, validate, and transform your data by removing duplicates, correcting formatting issues, handling missing values, standardizing data, and improving overall quality.
I also provide data analysis using Excel functions, Pivot Tables, charts, and summary reports to uncover trends and actionable insights. Whether you need data prepared for Power BI, reporting, business intelligence, or decision-making, I deliver professional, reliable results.
With over 10 years of experience in data management and analytics, I have helped organizations improve data quality, reporting, and operational efficiency. Every project is handled with accuracy, confidentiality, and attention to detail.
I also provide data analysis using Excel functions, Pivot Tables, charts, and summary reports to uncover trends and actionable insights. Whether you need data prepared for Power BI, reporting, business intelligence, or decision-making, I deliver professional, reliable results.
With over 10 years of experience in data management and analytics, I have helped organizations improve data quality, reporting, and operational efficiency. Every project is handled with accuracy, confidentiality, and attention to detail.
Data Tool
Microsoft ExcelWhat's included
| Service Tiers |
Starter
$40
|
Standard
$120
|
Advanced
$250
|
|---|---|---|---|
| Delivery Time | 2 days | 4 days | 7 days |
Number of Revisions | 2 | 3 | Unlimited |
Number of Pages Mined/Scraped | 1 | 5 | 10 |
Number of Sources Mined/Scraped | 1 | 3 | 5 |
About Olivier
Data Analytics | Power BI | SQL | GIS | Information Management Expert
Kigali, Rwanda - 4:27 am local time
I specialize in transforming complex data into actionable insights through Power BI, SQL, Python, Excel, ArcGIS/QGIS, KoboToolbox, and cloud-based data platforms. I have managed large-scale operational databases covering more than 120,000 beneficiaries, developed interactive dashboards and automated reporting systems, and strengthened data quality, governance, and decision-making for emergency and development programmes.
I can help organizations with:
• Data analysis and visualization (Power BI, Excel, SQL)
• Dashboard development and automation
• Database design and data quality improvement
• GIS mapping and spatial analysis
• Monitoring, evaluation, and humanitarian information management
• Survey design (KoboToolbox/ODK) and data collection
• Technical writing, SOP development, and analytical reporting
I am committed to delivering accurate, high-quality, and practical data solutions that help organizations make informed decisions and maximize impact.
Steps for completing your project
After purchasing the project, send requirements so Olivier can start the project.
Delivery time starts when Olivier receives requirements from you.
Olivier works on your project following the steps below.
Revisions may occur after the delivery date.
Step 1 – Review Your Data
I review your files, objectives, and expected deliverables.
Step 2 – Clean & Prepare Data
I clean, validate, standardize, and organize your Excel or CSV data.