You will get clean data analysis and machine learning insights
Project details
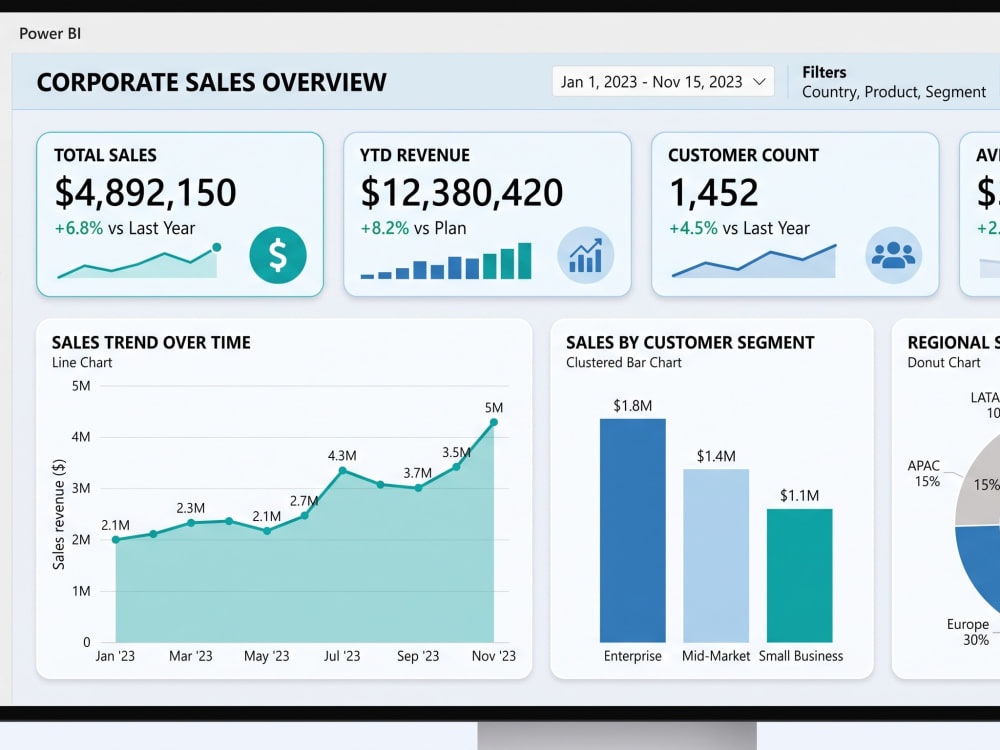
You will get clean, structured, and meaningful data analysis using Python, Excel, SQL, and Power BI. I can help you clean messy datasets, remove duplicates, handle missing values, create charts, analyze trends, and prepare clear insights for decision-making.
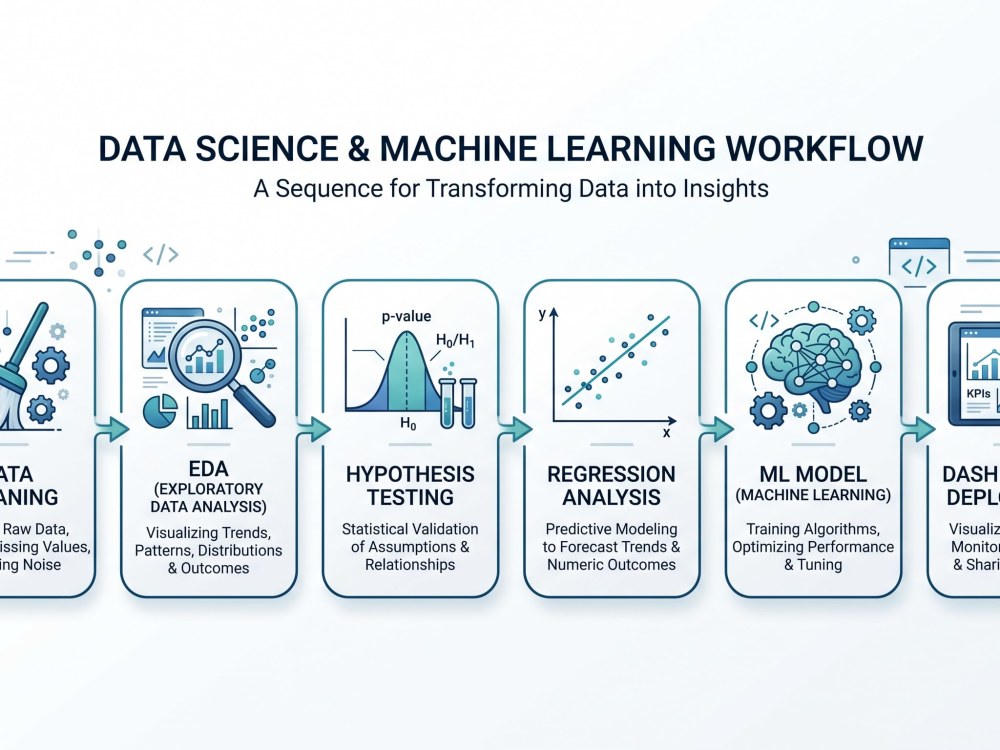
Depending on the package you choose, I can also build machine learning models such as regression, clustering, Random Forest, or XGBoost to predict outcomes or segment your data. The final delivery can include a cleaned dataset, Python notebook, visual charts, Power BI dashboard, summary report, and source code.
I focus on accuracy, clear communication, and organized delivery. I will review your requirements carefully, avoid assumptions, and explain the results in a simple and understandable way.
Depending on the package you choose, I can also build machine learning models such as regression, clustering, Random Forest, or XGBoost to predict outcomes or segment your data. The final delivery can include a cleaned dataset, Python notebook, visual charts, Power BI dashboard, summary report, and source code.
I focus on accuracy, clear communication, and organized delivery. I will review your requirements carefully, avoid assumptions, and explain the results in a simple and understandable way.
Machine Learning Tools
Microsoft Excel, Microsoft Power BI, NumPy, pandas, Python, PyTorch, R, scikit-learn, SPSS, SQL, XGBoostWhat's included
| Service Tiers |
Starter
$30
|
Standard
$80
|
Advanced
$150
|
|---|---|---|---|
| Delivery Time | 4 days | 2 days | 7 days |
Number of Revisions | 1 | 2 | 3 |
Number of Model Variations | 0 | 1 | 3 |
Number of Scenarios | 1 | 2 | 3 |
Number of Graphs/Charts | 3 | 6 | 10 |
Model Validation/Testing | - | - | |
Model Documentation | - | ||
Data Source Connectivity | - | ||
Source Code |
Optional add-ons
You can add these on the next page.
Fast Delivery
+$15 - $40
Additional Revision
+$10
Additional Graph/Chart
(+ 1 Day)
+$10
Model Documentation
(+ 1 Day)
+$10
Data Source Connectivity
(+ 1 Day)
+$25Frequently asked questions
About Feyzi
Data Analyst | Excel, Power BI, Google Sheets & Python Automation
Istanbul, Turkey - 4:47 pm local time
I am a Management Information Systems graduate with hands-on experience in data analysis, reporting, Excel automation, Power Query, Google Sheets, Power BI, and Python-based data cleaning. I have worked on real reporting projects involving large spreadsheets, advisor/student tracking files, performance analysis, survey results, KPI reports, and automated file processing.
Here is what I can help you with:
• Cleaning and organizing Excel, CSV, and Google Sheets data
• Creating clear Power BI dashboards and KPI reports
• Building Excel reports with formulas, pivot tables, charts, and Power Query
• Automating repetitive spreadsheet tasks with Python or Google Apps Script
• Merging, splitting, and transforming multiple files
• Preparing business, sales, customer, survey, or academic performance reports
• Turning raw data into simple insights and visual summaries
Tools I use:
Excel, Power Query, Power BI, Google Sheets, Python, Pandas, SQL, Google Apps Script, and basic data visualization tools.
I focus on accuracy, clean structure, clear communication, and practical results. My goal is not only to create a report, but to make your data easier to understand and easier to use.
If you have messy spreadsheets, repeated manual reporting tasks, or data that needs to be turned into a dashboard, I can help you create a clean and reliable solution.
Steps for completing your project
After purchasing the project, send requirements so Feyzi can start the project.
Delivery time starts when Feyzi receives requirements from you.
Feyzi works on your project following the steps below.
Revisions may occur after the delivery date.
Review the data and requirements
I will review your dataset, project goals, required outputs, and any important columns or business questions before starting the analysis.
Clean and prepare the dataset
I will check missing values, duplicates, inconsistent formats, outliers, and prepare the dataset for analysis, visualization, or modeling.