You will get custom visualization R ggplot2

Project details
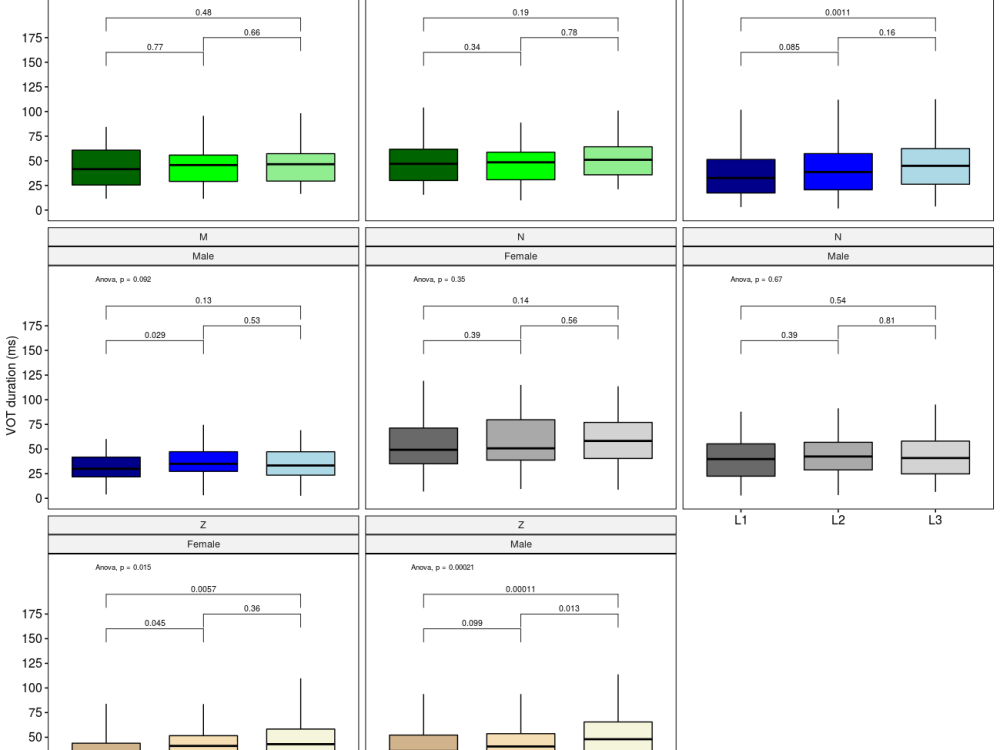
custom visualization using various R library. ggplots ggpubr circular plots heatmap data insights plotly maps GIS and many more . you have a idea i will create visual for you
Data Tool
RWhat's included
| Service Tiers |
Starter
$25
|
Standard
$50
|
Advanced
$200
|
|---|---|---|---|
| Delivery Time | 1 day | 1 day | 7 days |
Number of Revisions | 1 | 2 | Unlimited |
Number of Graphs/Charts | 1 | 3 | 10 |
Number of Variations | 2 | 3 | |
Data Source Connectivity | - | - | - |
Web Embedding | - | - | - |
Interactive/Animated Visuals | - | - | - |
About sneha
Biostatistician Machine Learning R Bioinformatics PERL Python
Pune, India - 8:55 am local time
Area of expertise:
-Interpret Data & Analyse results using statistical techniques and provide ongoing reports.
-Develop & Implement database, Data Collection System, Data Analytic s and other strategics that optimize the statistical efficiency & quality.
-Identify, Analyze & Maintain the trends.
Steps for completing your project
After purchasing the project, send requirements so sneha can start the project.
Delivery time starts when sneha receives requirements from you.
sneha works on your project following the steps below.
Revisions may occur after the delivery date.
R script
R script for visualization will be shared with cleint .