You will get Data Cleaning and Data Entry using Excel (Pivot Table)
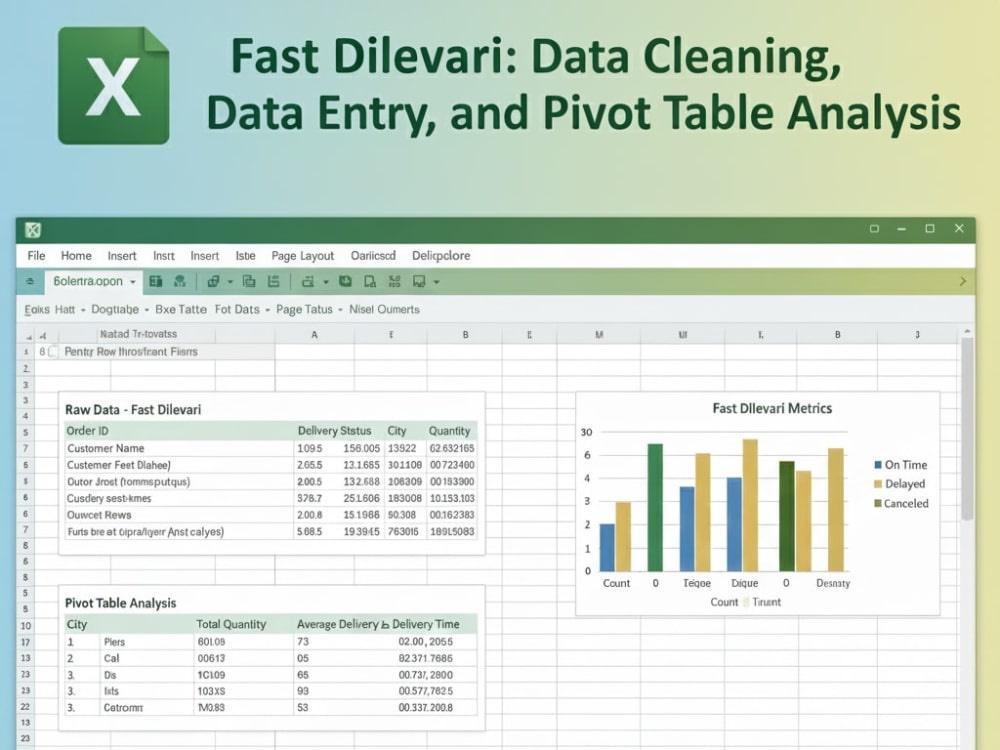
Project details
Project Scope & Expertise
I offer a complete solution for managing your business data. My goal is to take your unorganized information and turn it into a high-functioning tool for your business.
1. Data Cleaning (The Foundation)
Removing duplicate entries and redundant information.
Standardizing formats (Dates, Currency, Phone Numbers).
Separating combined data (e.g., splitting "Full Name" into First and Last).
Cleaning up "hidden" characters or formatting errors from web scraping.
2. Data Entry (The Process)
High-speed, error-free manual data entry.
Converting PDF/Scanned images into editable Excel formats.
Data mining from web sources directly into structured spreadsheets.
3. Pivot Tables & Insights (The Result)
Building interactive Pivot Tables to filter and sort large datasets.
Creating calculated fields to find totals, averages, and percentages.
Visualizing data trends through Pivot Charts for quick decision-making.
Why This Matters
Messy data leads to wrong decisions. By using Pivot Tables, I transform thousands of rows of data into a single-page summary that tells you exactly how your business or project is performing.
I offer a complete solution for managing your business data. My goal is to take your unorganized information and turn it into a high-functioning tool for your business.
1. Data Cleaning (The Foundation)
Removing duplicate entries and redundant information.
Standardizing formats (Dates, Currency, Phone Numbers).
Separating combined data (e.g., splitting "Full Name" into First and Last).
Cleaning up "hidden" characters or formatting errors from web scraping.
2. Data Entry (The Process)
High-speed, error-free manual data entry.
Converting PDF/Scanned images into editable Excel formats.
Data mining from web sources directly into structured spreadsheets.
3. Pivot Tables & Insights (The Result)
Building interactive Pivot Tables to filter and sort large datasets.
Creating calculated fields to find totals, averages, and percentages.
Visualizing data trends through Pivot Charts for quick decision-making.
Why This Matters
Messy data leads to wrong decisions. By using Pivot Tables, I transform thousands of rows of data into a single-page summary that tells you exactly how your business or project is performing.
Data Tool
Microsoft ExcelWhat's included
| Service Tiers |
Starter
$10
|
Standard
$18
|
Advanced
$25
|
|---|---|---|---|
| Delivery Time | 1 day | 2 days | 3 days |
Number of Revisions | 1 | 2 | 3 |
Number of Pages Mined/Scraped | 1 | 2 | 4 |
Number of Sources Mined/Scraped | 1 | 2 | 4 |
Optional add-ons
You can add these on the next page.
Fast Delivery
+$5 - $10Frequently asked questions
About Balai
I will analyze your data using Excel, Power BI, Python (NumPy, Pandas)
Pilibhit, India - 8:13 am local time
Python for Data Science: Automated data cleaning and processing.
Advanced Excel: Expert in Pivot Tables, VLOOKUP, and Power Query.
SQL, POWER BI
Data Analytics: Transforming complex data into easy-to-understand visual reports
Steps for completing your project
After purchasing the project, send requirements so Balai can start the project.
Delivery time starts when Balai receives requirements from you.
Balai works on your project following the steps below.
Revisions may occur after the delivery date.
Data Cleaning and Data Entry using Excel (Pivot Table)
Expert Data Cleaning & Entry using Excel. I specialize in removing duplicates, formatting messy datasets, and organizing information into professional Pivot Tables for clear, actionable insights and reporting