You will get Data visualization for Web Apps | React
Project details
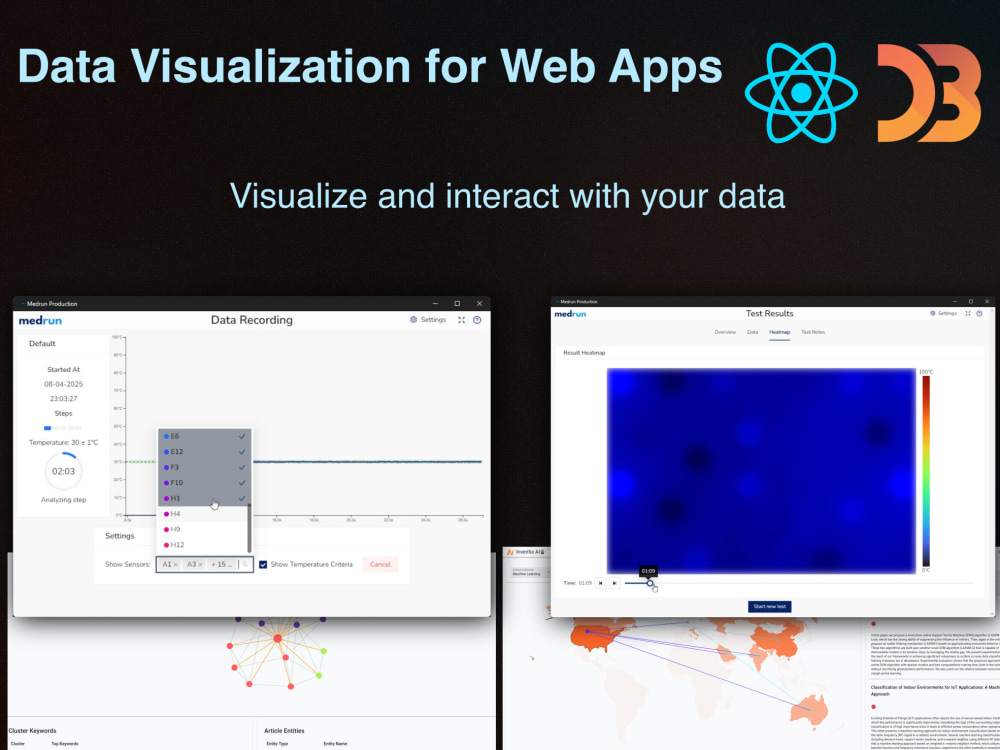
Need to add powerful data visualizations to your React application? I specialize in integrating interactive charts, dashboards, and visual analytics that transform raw data into engaging user experiences. Whether you have an existing React app or need a new data-driven solution, I create visualizations that inform, engage, and drive decisions.
💼 What I Offer:
📈 Data Visualization Excellence
• Interactive charts and graphs using D3.js and Canvas technologies
• Real-time data monitoring and live feed visualizations
• Custom dashboard development with dynamic filtering and controls
⚛️ React Integration Expertise
• Seamless integration into existing React applications
• Modern UI frameworks (Material UI, Chakra UI, Ant Design) compatibility
• Performance optimization for large datasets and complex visualizations
📞 Ready to Get Started?
Let's discuss your project requirements! 🚀
💼 What I Offer:
📈 Data Visualization Excellence
• Interactive charts and graphs using D3.js and Canvas technologies
• Real-time data monitoring and live feed visualizations
• Custom dashboard development with dynamic filtering and controls
⚛️ React Integration Expertise
• Seamless integration into existing React applications
• Modern UI frameworks (Material UI, Chakra UI, Ant Design) compatibility
• Performance optimization for large datasets and complex visualizations
📞 Ready to Get Started?
Let's discuss your project requirements! 🚀
Programming Languages
JavaScript, TypeScriptCoding Expertise
Performance OptimizationWhat's included
| Service Tiers |
Starter
$75
|
Standard
$200
|
Advanced
$300
|
|---|---|---|---|
| Delivery Time | 3 days | 5 days | 7 days |
Number of Revisions | 2 | 2 | 2 |
Number of Pages | 1 | 1 | 1 |
Design Customization | |||
Content Upload | - | - | - |
Responsive Design | - | - | - |
Source Code | - | - | - |
Optional add-ons
You can add these on the next page.
Additional Revision
+$20
Additional Page
(+ 2 Days)
+$50
Responsive Design
(+ 1 Day)
+$20
Data source integration
(+ 2 Days)
+$30
Data transforms
(+ 1 Day)
+$20
Advanced visualization
(+ 2 Days)
+$75
2 reviews
(2)
(0)
(0)
(0)
(0)
This project doesn't have any reviews.
VT
Virgil T.
Jan 9, 2024
System Development
Exceptional work. Our project was done in record time. Mo knows his stuff, I wish we had him as a full time employee.
DL
Daniel L.
Jun 7, 2022
Ivy Contributor
About Muhammad Saad
Web Development | React | MERN | Data Visualization | D3.js
Rawalpindi, Pakistan - 6:25 pm local time
I'm a passionate frontend developer specializing in creating stunning, interactive React applications with cutting-edge data visualizations. With 3+ years of hands-on experience, I excel at transforming complex data into compelling visual stories using React, D3.js, and modern UI frameworks like Material UI, Chakra UI, and Ant Design. My expertise spans building responsive, performant web applications with advanced features including real-time data monitoring, interactive dashboards, and seamless user experiences that engage and inform your audience.
💼 Proven Track Record & Technical Excellence
I bring a comprehensive skill set that extends beyond frontend development, with solid experience in full-stack solutions using the MERN stack, RESTful API development, and AWS deployment. My recent projects include developing AI-powered web applications with sophisticated data visualization capabilities, creating Next.js websites with custom SVG animations using Framer Motion, and building desktop applications with Electron.js. Whether you need a data-rich dashboard, an interactive web application, or a complete frontend solution, I deliver scalable, maintainable code that exceeds expectations and drives results. ✨
Steps for completing your project
After purchasing the project, send requirements so Muhammad Saad can start the project.
Delivery time starts when Muhammad Saad receives requirements from you.
Muhammad Saad works on your project following the steps below.
Revisions may occur after the delivery date.
Requirements finalization
Discuss the data source and required visualizations.
Visualize dataset
Create visualizations for the data.