You will get Data visualization for your data using ggplot2 - R
Top Rated


Project details
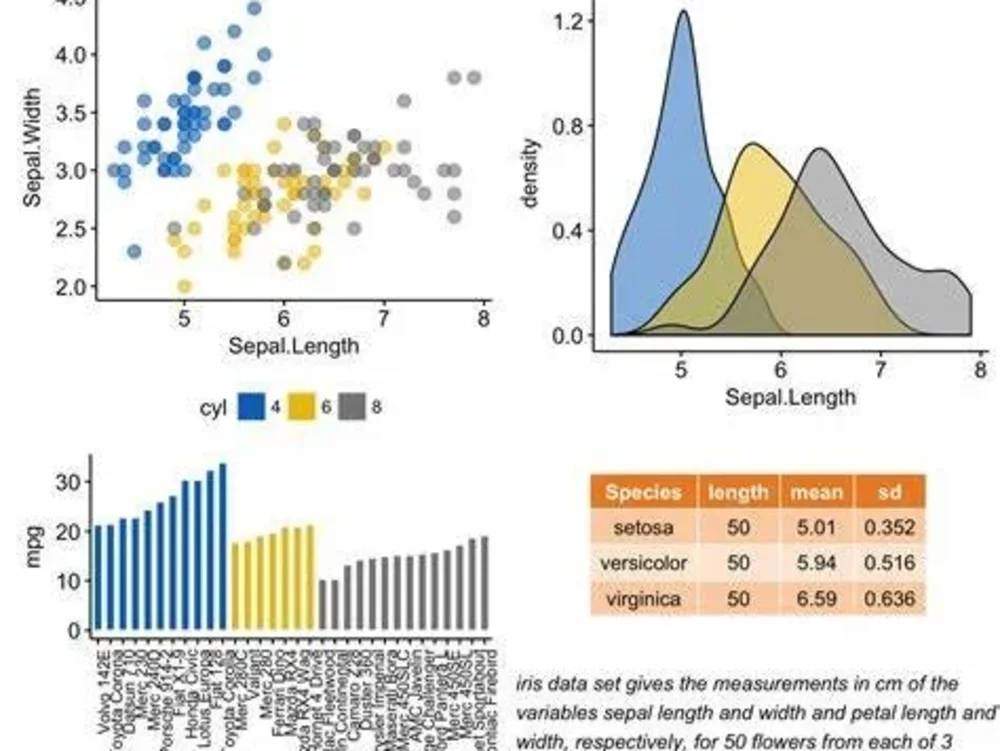
Custom visualization from your data!
You can:
- Choose the chart type (e.g. line chart, bar chart, point chart, or any other you want)
- Select the colors (or color palette) used in charts
- Send your custom logo
You can:
- Choose the chart type (e.g. line chart, bar chart, point chart, or any other you want)
- Select the colors (or color palette) used in charts
- Send your custom logo
Data Tool
RWhat's included
| Service Tiers |
Starter
$50
|
Standard
$100
|
Advanced
$300
|
|---|---|---|---|
| Delivery Time | 7 days | 10 days | 15 days |
Number of Revisions | 0 | 1 | 3 |
Number of Graphs/Charts | 10 | 15 | 30 |
Number of Variations | 0 | 1 | 2 |
Data Source Connectivity | - | - | |
Web Embedding | - | - | |
Interactive/Animated Visuals | - |
Optional add-ons
You can add these on the next page.
Fast Delivery
+$20 - $100
Additional Revision
+$20
Additional Graph/Chart
(+ 1 Day)
+$10
116 reviews
(109)
(3)
(3)
(0)
(1)
NP
Nikos P.
Aug 26, 2024
NP
Nikos P.
Aug 23, 2024
SM
Shahed M.
Jun 8, 2026
Fix the models
He is experienced in his field. You can rely on him. I wish him success in his life.
ME
Mohamad E.
May 7, 2025
Helping in designing course material for stat stu
AF
Ali F.
Mar 3, 2025
Statistical significance testing for merging clusters
Excellent data scientist. I worked with him for over 2 years continuously. I highly recommend him for all your data science needs.
AA
Ahmed A.
Feb 3, 2025
R shiny app
KK
Kumar K.
Jan 31, 2025
R shiny errors
About ahmad
Data Scientist / Statistician | R/Python expert
100%
Job Success
Ghobeiry, Lebanon - 6:45 am local time
R Packages:
tidyverse, tidymodels, dplyr, ggplot2, caret, randomForest, glmnet, xgboost, nnet, lme4, forecast, data.table, readr, stringr, Shiny, Quarto, R Markdown and much more
Python Packages:
pandas, numpy, scikit-learn, statsmodels, matplotlib, seaborn, plotly, TensorFlow, Keras, PyTorch, XGBoost, LightGBM, CatBoost.
Other Tools:
SPSS, SAS, Minitab,Power BI, PASS, Microsoft Excel/Office, SQL, Power BI etc...
I deliver clean, reproducible, and decision-ready analytics — from statistical modeling and survey analysis to machine learning pipelines and dashboards.
Steps for completing your project
After purchasing the project, send requirements so ahmad can start the project.
Delivery time starts when ahmad receives requirements from you.
ahmad works on your project following the steps below.
Revisions may occur after the delivery date.
Receive data and requirement
I'll check if data fit the requirement
Building the visualization