You will get Descriptive Statistics & Data Visualization Using R, SAS, or SPSS
Project details
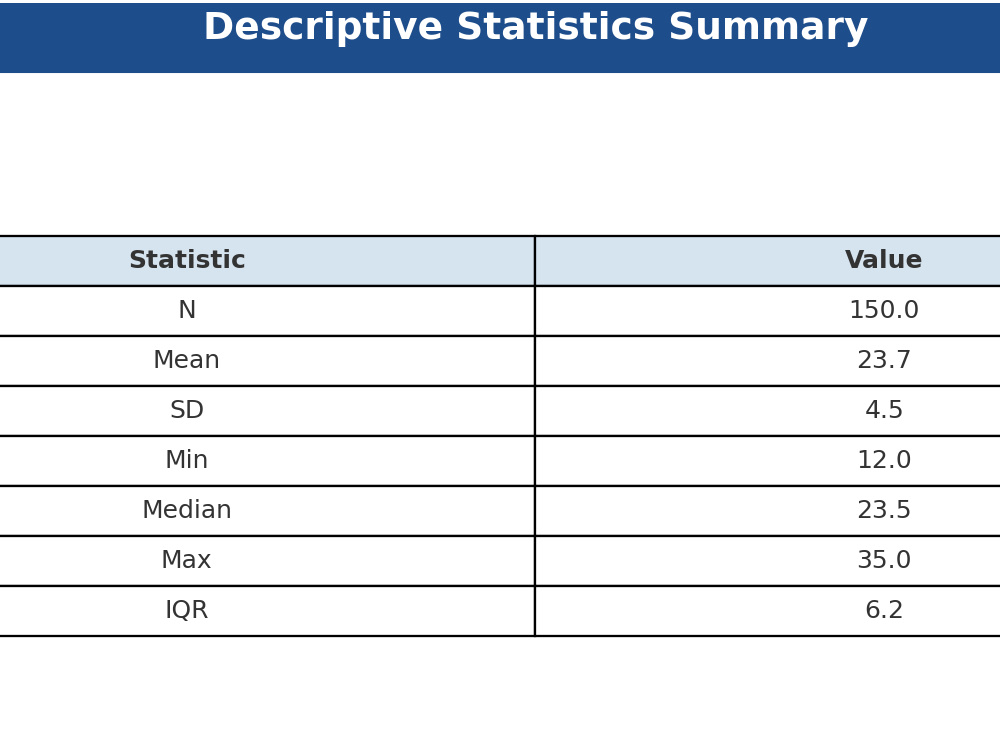
This project delivers clean, accurate, and publication-ready descriptive statistics and visualizations using R, SAS, or SPSS—based entirely on your preference. What sets this project apart is the blend of biostatistics expertise, clinical research experience, and reproducible statistical programming, ensuring clients receive polished outputs suitable for academic work, research reports, business insights, or regulatory deliverables.
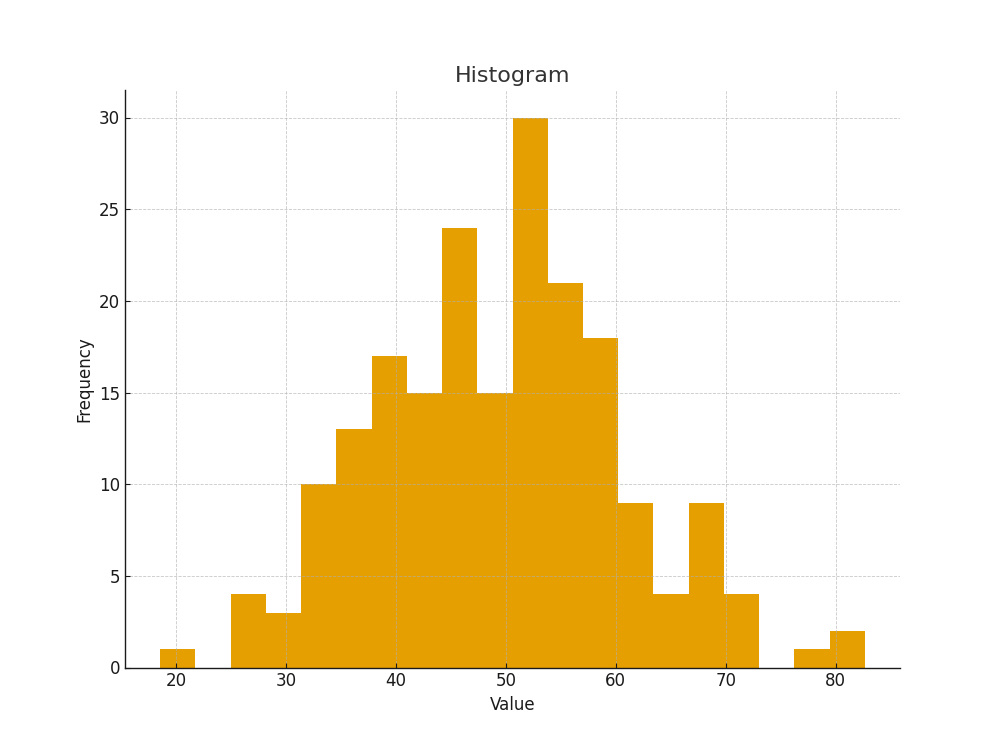
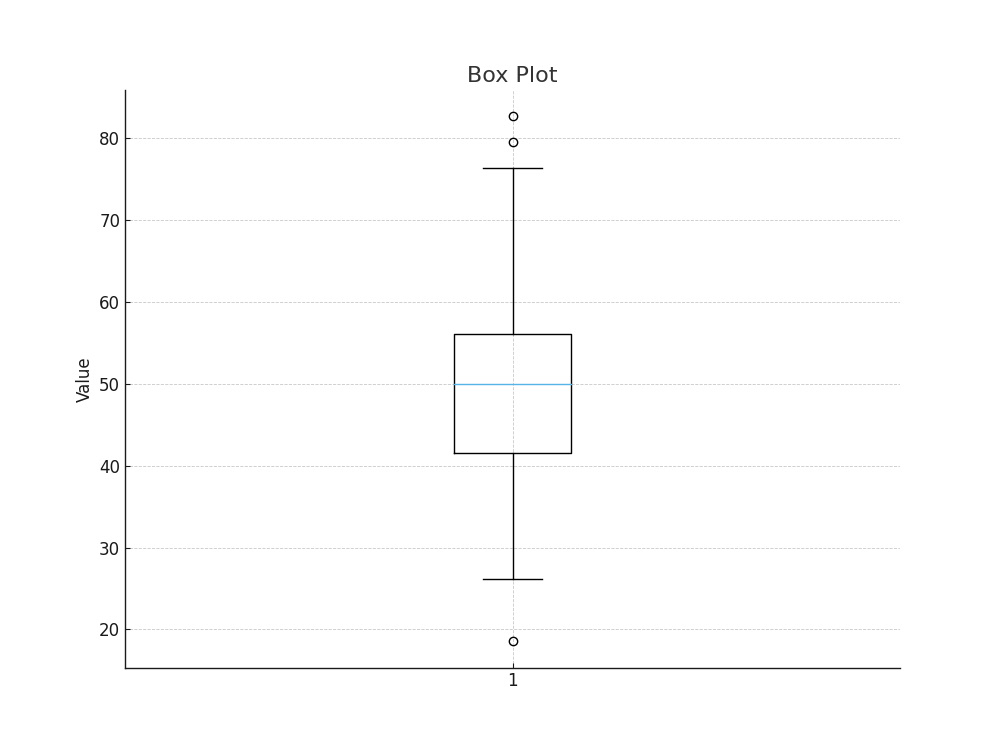
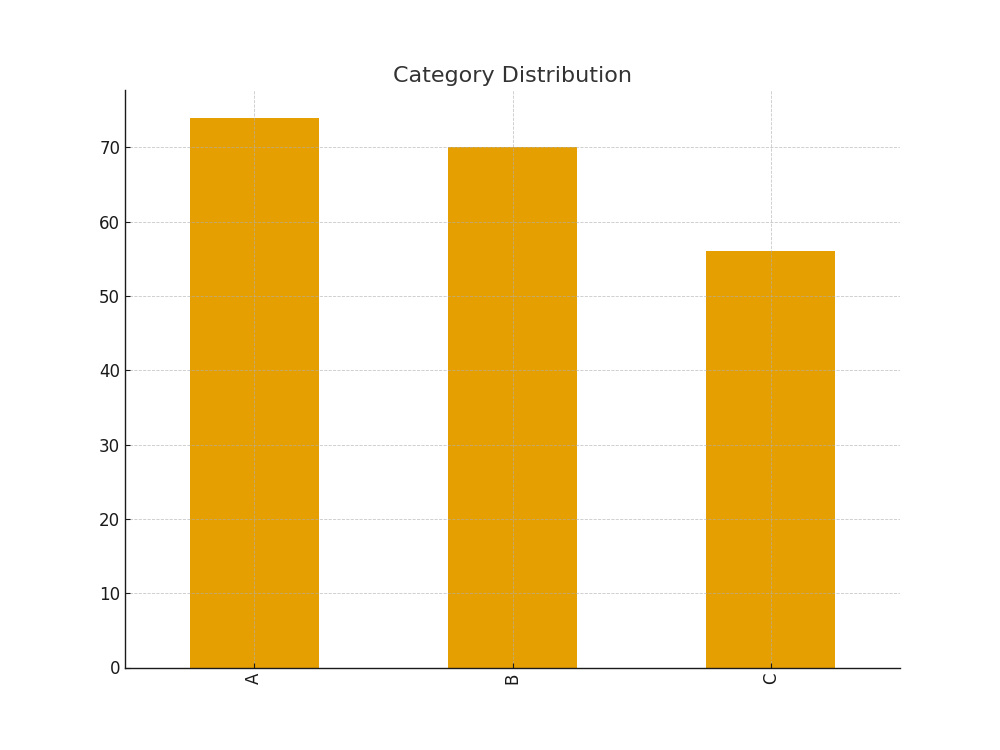
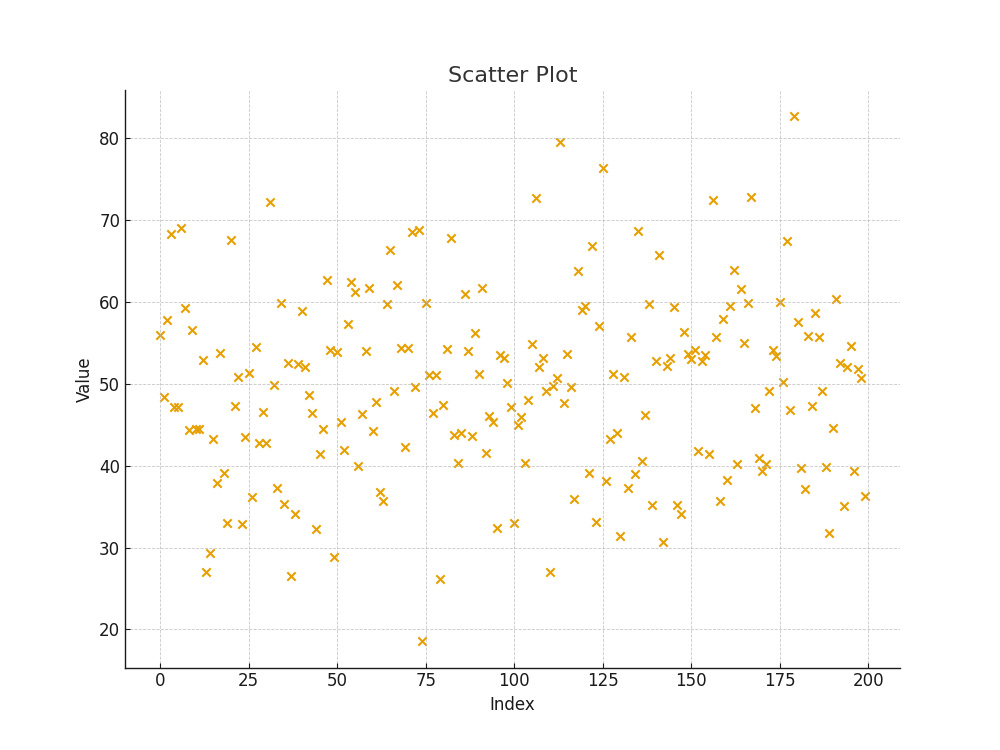
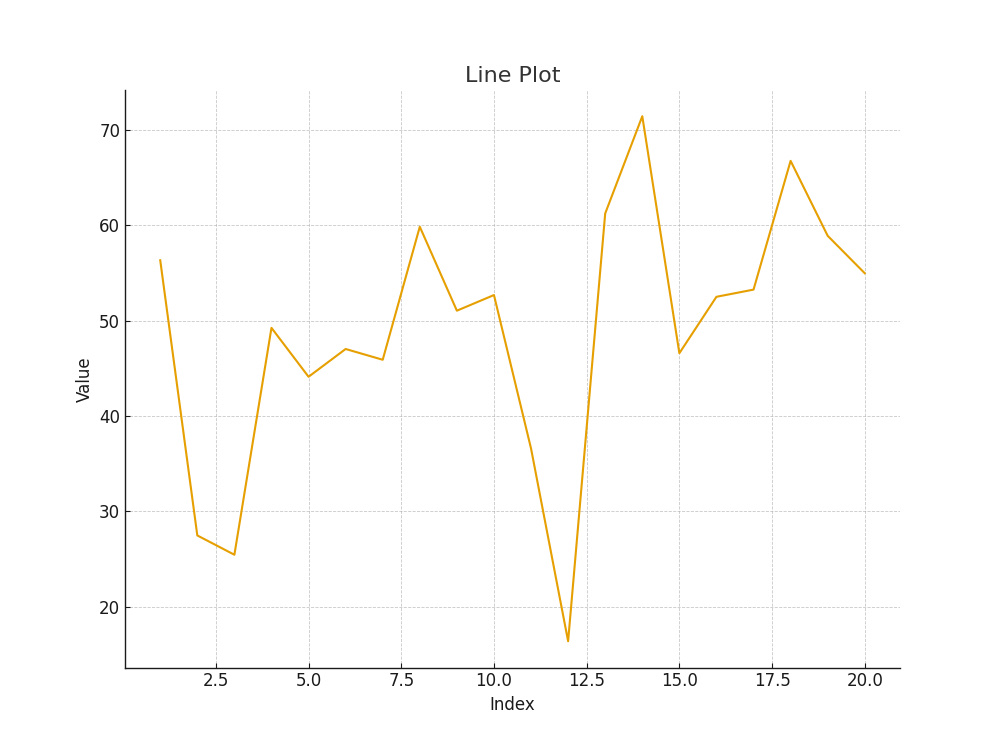
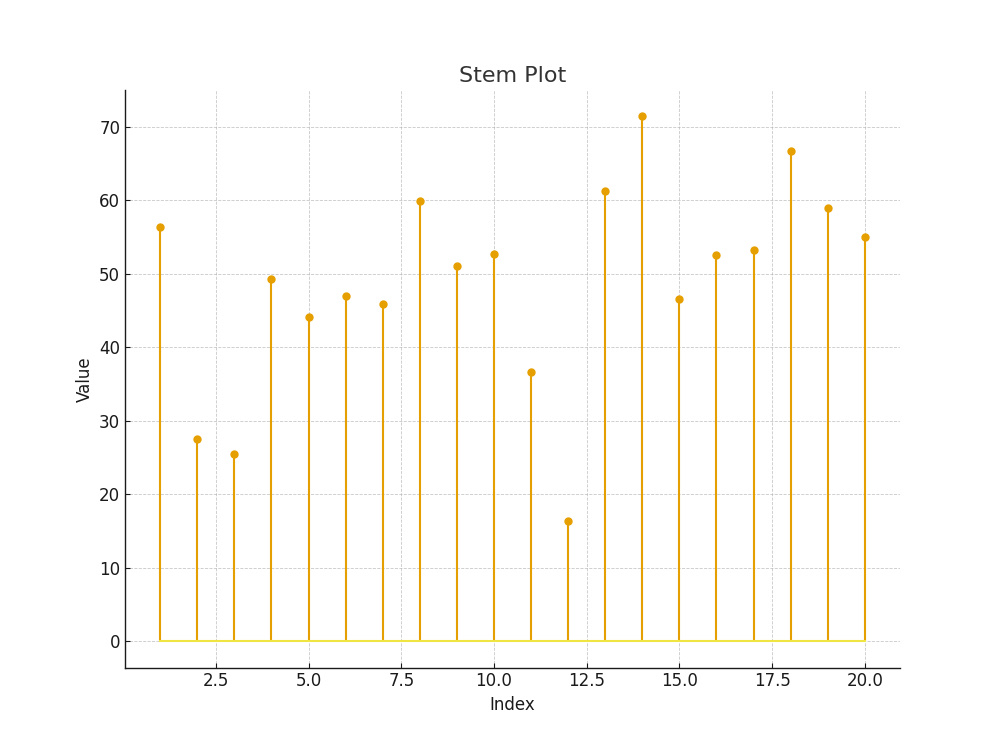
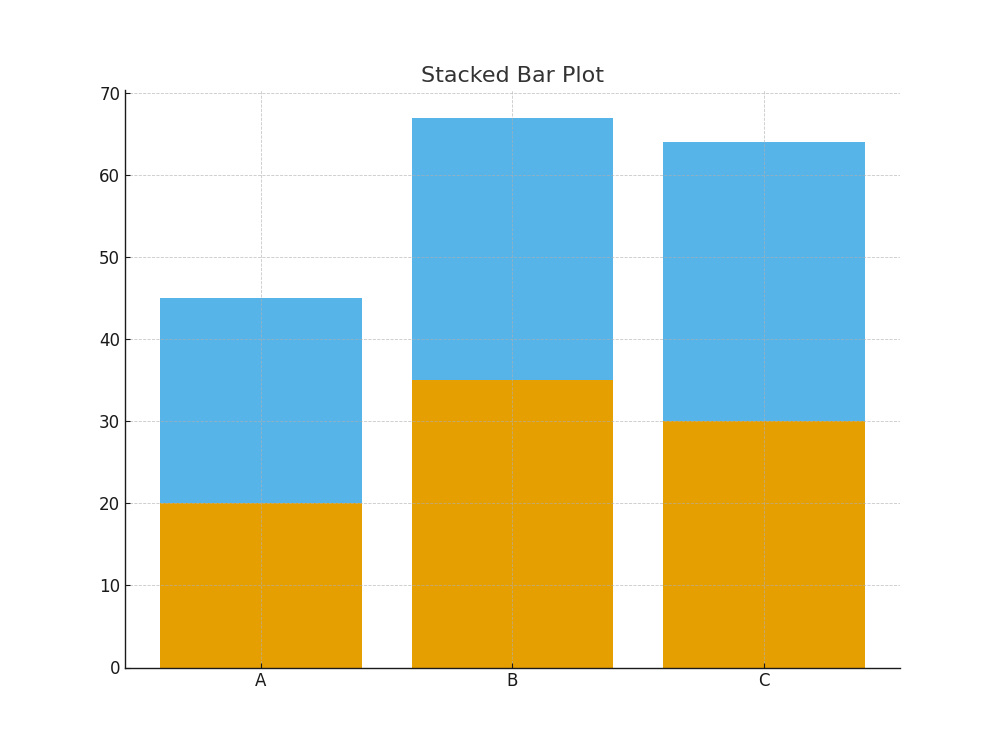
You not only receive clear summary tables, frequency analyses, and visuals (histogram/boxplot), but you also get professional formatting, a blue-themed portfolio style, and—if needed—supporting interpretation written in concise analytical language.
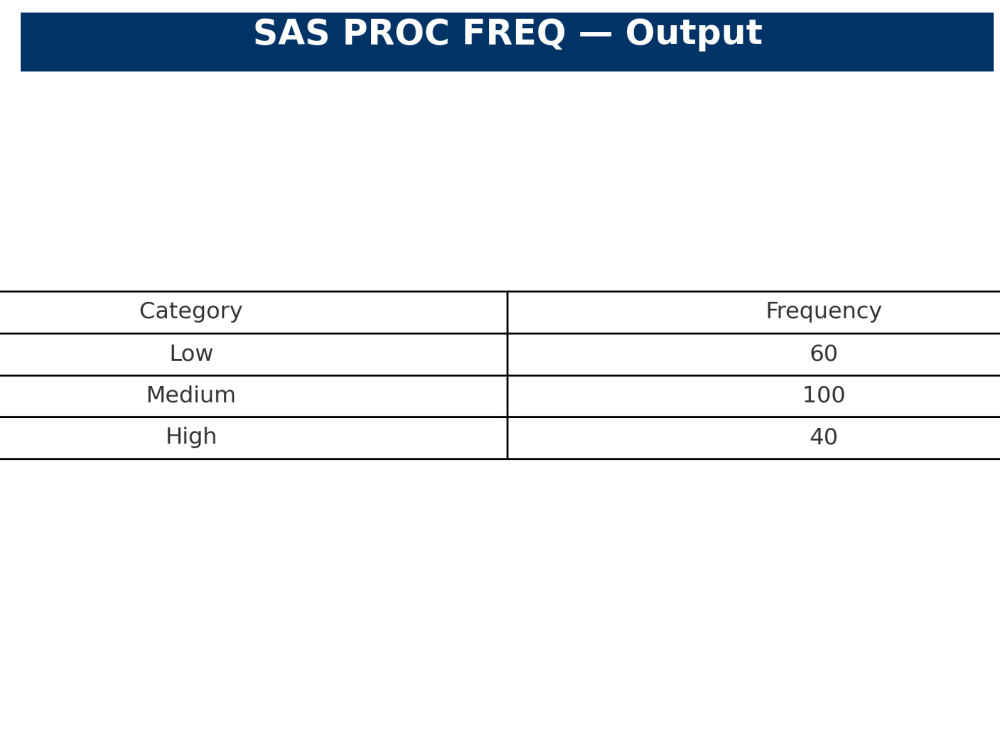
I also provide software-specific outputs resembling R, SAS PROC MEANS/PROC FREQ, and SPSS Descriptives, giving your report a polished, real-analysis appearance.
Whether you're a researcher, student, clinician, or business analyst, this project gives you fast, accurate results with clean visuals and optional interpretation, tailored to your dataset and objective.
You not only receive clear summary tables, frequency analyses, and visuals (histogram/boxplot), but you also get professional formatting, a blue-themed portfolio style, and—if needed—supporting interpretation written in concise analytical language.
I also provide software-specific outputs resembling R, SAS PROC MEANS/PROC FREQ, and SPSS Descriptives, giving your report a polished, real-analysis appearance.
Whether you're a researcher, student, clinician, or business analyst, this project gives you fast, accurate results with clean visuals and optional interpretation, tailored to your dataset and objective.
Data Tool
SASWhat's included
| Service Tiers |
Starter
$20
|
Standard
$40
|
Advanced
$80
|
|---|---|---|---|
| Delivery Time | 1 day | 2 days | 3 days |
Number of Revisions | 1 | 2 | 3 |
Source Code | - |
Optional add-ons
You can add these on the next page.
Fast Delivery
+$50 - $100
Additional Revision
+$5
Additional Visualizations
(+ 1 Day)
+$5
Statistical Interpretation Report
(+ 1 Day)
+$10
Code Delivery (R / SAS / SPSS)
+$15About Kritika
Clinical Trial Biostatistician | SAP, CSR, CDISC | R, SAS, SPSS
Lucknow, India - 12:44 pm local time
My goal is to deliver clear, reliable, and reproducible results that help clients achieve strong research outcomes and informed decision-making.
Statistical Analysis & Methods:
Descriptive Statistics & Inferential Statistics
Parametric and Non-Parametric Tests
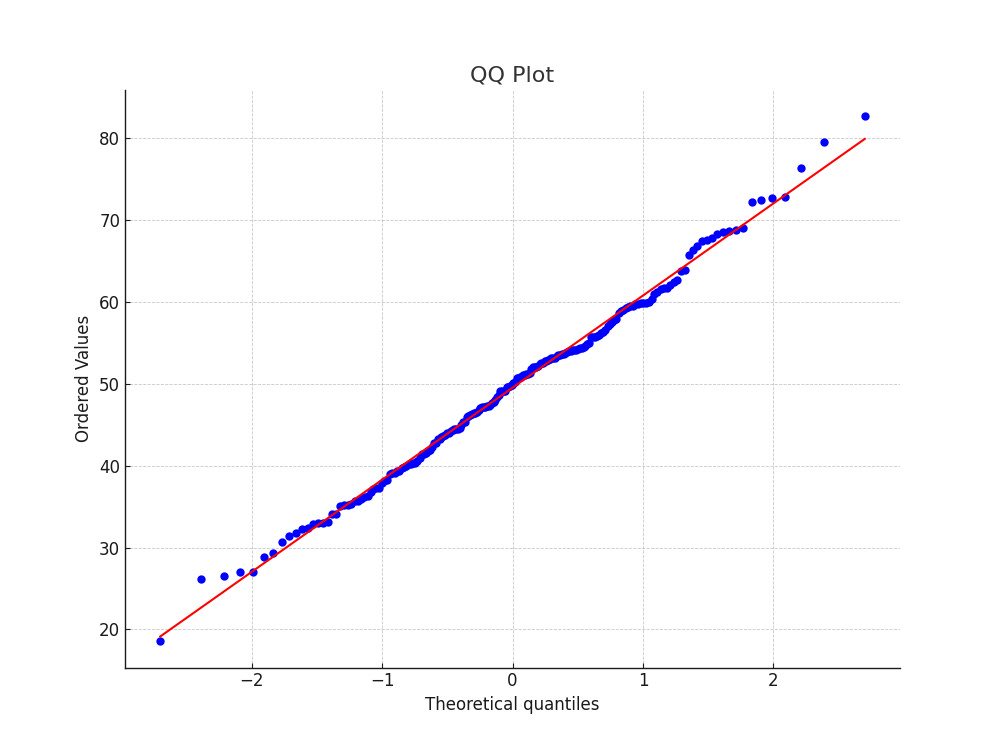
Normality Testing & Normal Distribution Analysis
Missing Data Handling & Imputation Techniques
Odds Ratio, Risk Ratio & Effect Size Estimation
Survival Analysis (KM, Cox Model)
Sample Size Calculation & Power Analysis
Statistical Analysis Plans (SAP)
Randomization Methods (Block, Stratified, Simple)
Tools & Programming:
R, SAS, SPSS
Data Cleaning, Validation & EDA
Reproducible Reporting (Markdown, Scripts, Automation)
Research & Clinical Analytics:
Clinical Data Analysis (Phases I–IV)
Thesis, dissertation & publication statistical support
Steps for completing your project
After purchasing the project, send requirements so Kritika can start the project.
Delivery time starts when Kritika receives requirements from you.
Kritika works on your project following the steps below.
Revisions may occur after the delivery date.
Client Purchases the Project
The client selects the appropriate tier (Starter, Standard, or Advanced) based on their needs.
Client Submits Required Materials
To begin, the client provides: The dataset (Excel, CSV, SPSS, SAS, or R format) Study or analysis objective Variable descriptions (if available) Any formatting or reporting preferences