You will get clean data with transparent EDA visualization
Project details
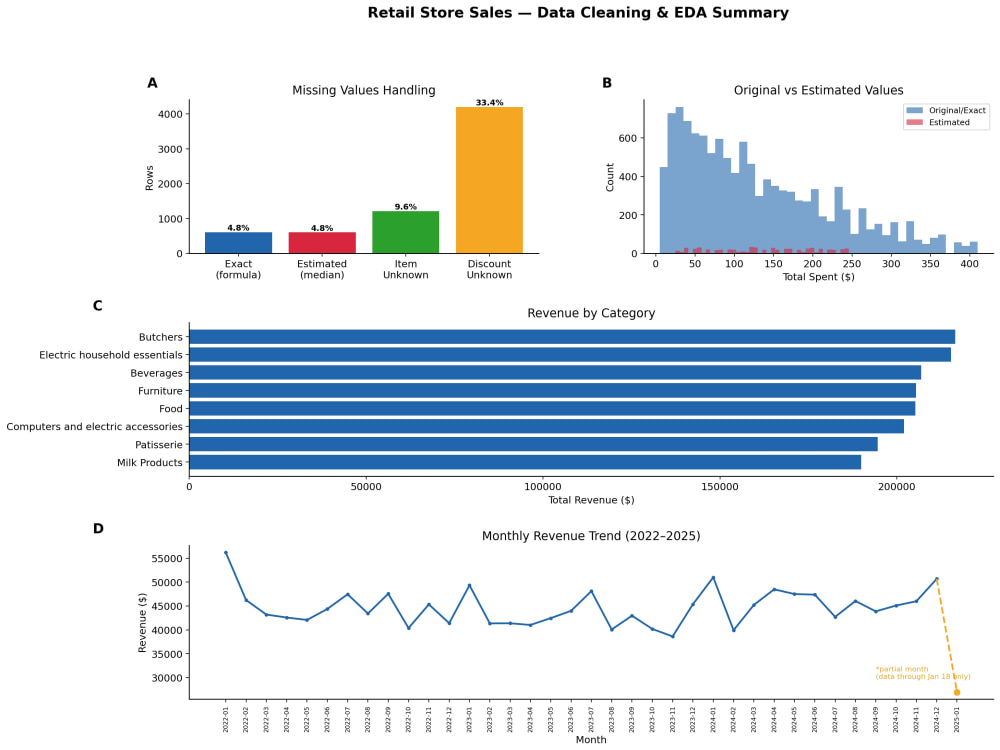
I don't just delete or average missing values — I diagnose your dataset first. Every gap is either restored with exact math (when the data allows it), estimated transparently and flagged, or left honestly labeled as unknown. You'll always know which numbers are real and which are calculated. My EDA charts follow publication standards (300dpi, clear labels, documented statistics) — the kind of output used in real research and business reports, not default spreadsheet graphs. I also catch data artifacts most freelancers miss, like incomplete time periods that create fake "drops" in trend charts, so your analysis tells the true story, not a misleading one.
Data Tool
PythonWhat's included
| Service Tiers |
Starter
$35
|
Standard
$55
|
Advanced
$75
|
|---|---|---|---|
| Delivery Time | 2 days | 2 days | 2 days |
Number of Revisions | Unlimited | Unlimited | Unlimited |
Frequently asked questions
About Nuzhnenko
Bioinformatics Specialist | RNA-Seq, Molecular Docking & Data Visualiz
Poznan, Poland - 8:01 am local time
What I can help with:
🧬 Transcriptomics & Functional Genomics
Bulk RNA-Seq differential expression analysis (DESeq2), volcano plots, heatmaps, PPI network hub gene identification (STRING + Cytoscape), and single-cell RNA-seq analysis (Scanpy) — QC, clustering, UMAP, marker gene identification.
🦠 Microbiome Analysis
ASV/OTU taxonomic profiling, alpha/beta diversity (phyloseq), and environmental correlation analysis (CCA) for 16S/metagenomic datasets.
💊 Drug Discovery & Molecular Dynamics
Protein-ligand molecular docking (AutoDock Vina), binding pose visualization with hydrogen bonds (ChimeraX/PyMOL), and MD trajectory analysis (RMSD, RMSF, radius of gyration via MDAnalysis).
🧪 Clinical Genomics
VCF variant annotation (Ensembl VEP, ClinVar filtering), IGV visualization, and machine learning biomarker discovery (Random Forest, ROC curves, feature importance).
📊 Publication-Ready Scientific Figures
Volcano plots, PCA, heatmaps, Kaplan-Meier survival curves, Circos plots — all delivered at 300dpi with colorblind-safe palettes and journal-ready formatting.
Every analysis comes with transparent methodology: tool versions, parameters, random seeds, and honest notes on QC filtering and any borderline findings — because reproducibility and accuracy matter more than a pretty picture when it's going into your paper or thesis.
Tools: R (DESeq2, phyloseq, vegan, ggplot2), Python (Scanpy, MDAnalysis, RDKit, scikit-learn), Cytoscape, ChimeraX/PyMOL, IGV.
📈 Statistical Analysis Beyond Biology
The same rigor I apply to genomic data — hypothesis testing, survival analysis, predictive modeling — works just as well outside biology. I take on general data analysis projects: A/B test evaluation, churn/time-to-event modeling, classification with transparent performance metrics (ROC/AUC, feature importance), and publication-quality data visualization for any domain. If your data has a clear question and a way to test it, I can help — regardless of field.
Message me with your dataset and goal — happy to advise on the right approach before you commit to a project.
Steps for completing your project
After purchasing the project, send requirements so Nuzhnenko can start the project.
Delivery time starts when Nuzhnenko receives requirements from you.
Nuzhnenko works on your project following the steps below.
Revisions may occur after the delivery date.
Data audit & diagnosis
I review your file, map every missing value, and check for hidden patterns (e.g. price × quantity relationships) before touching anything.
Clean & impute missing data
Values are restored using exact math where possible, or clearly flagged as estimated. Nothing is silently guessed — every fix is documented.