You will get I will perform data cleaning and build an interactive business dashboard
Project details
Are you drowning in spreadsheets but still struggling to make confident business decisions?
Many businesses have a massive amount of raw data, but very few know how to extract the hidden patterns to turn it into a strategic advantage. That is exactly where I step in.
Unlike standard reporting services that just hand you a static Excel file or generic charts, I build fully interactive, custom web-based dashboards using Python and Streamlit. My focus is entirely on Business Intelligence and Actionable Insights.
Here is what sets this project apart:
Strategic Business Logic: I don't just plot numbers on a graph. I implement advanced analytics like RFM (Recency, Frequency, Monetary) segmentation to help you understand customer behavior, identify your most valuable buyers, and reduce churn rates.
End-to-End Data Solution: You don't need to hire a separate person to clean your data. From structuring messy CSV/SQL files to deploying a live, clickable web application, I handle the entire pipeline seamlessly.
Stop guessing and start making data-backed decisions. Let's transform your raw data into a clear roadmap for growth!
Many businesses have a massive amount of raw data, but very few know how to extract the hidden patterns to turn it into a strategic advantage. That is exactly where I step in.
Unlike standard reporting services that just hand you a static Excel file or generic charts, I build fully interactive, custom web-based dashboards using Python and Streamlit. My focus is entirely on Business Intelligence and Actionable Insights.
Here is what sets this project apart:
Strategic Business Logic: I don't just plot numbers on a graph. I implement advanced analytics like RFM (Recency, Frequency, Monetary) segmentation to help you understand customer behavior, identify your most valuable buyers, and reduce churn rates.
End-to-End Data Solution: You don't need to hire a separate person to clean your data. From structuring messy CSV/SQL files to deploying a live, clickable web application, I handle the entire pipeline seamlessly.
Stop guessing and start making data-backed decisions. Let's transform your raw data into a clear roadmap for growth!
Data Tool
PythonWhat's included
| Service Tiers |
Starter
$50
|
Standard
$120
|
Advanced
$250
|
|---|---|---|---|
| Delivery Time | 3 days | 5 days | 7 days |
Number of Revisions | 1 | 2 | 4 |
Number of Pages Mined/Scraped | 1 | 2 | 4 |
Number of Sources Mined/Scraped | 1 | 2 | 3 |
About Diki
Data Analyst | Python & Streamlit Dashboard Developer
Bandung, Indonesia - 3:01 pm local time
Whether you have e-commerce transaction logs, retail sales records, or custom datasets, I can clean, process, and visualize your data to uncover hidden trends. I don't just deliver static spreadsheets; I build fully deployed, interactive web applications that you and your team can access directly from your browser.
What I can do for you:
Data Cleaning & Preprocessing: Handling missing values, filtering out anomalies (like canceled transactions), and structuring messy datasets for accurate analysis.
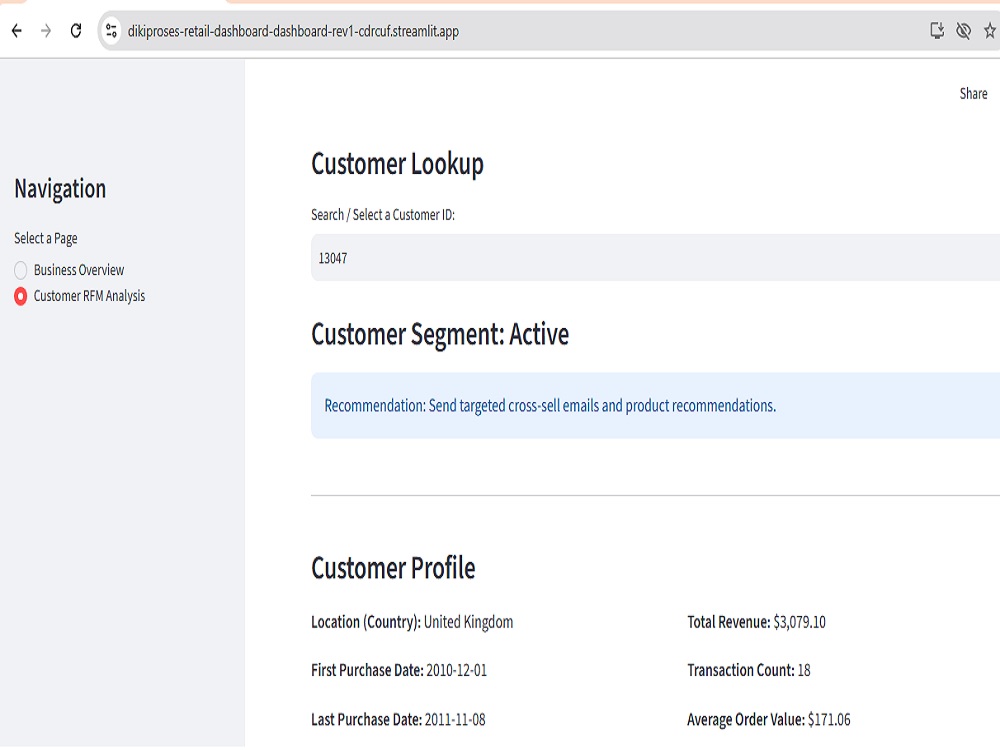
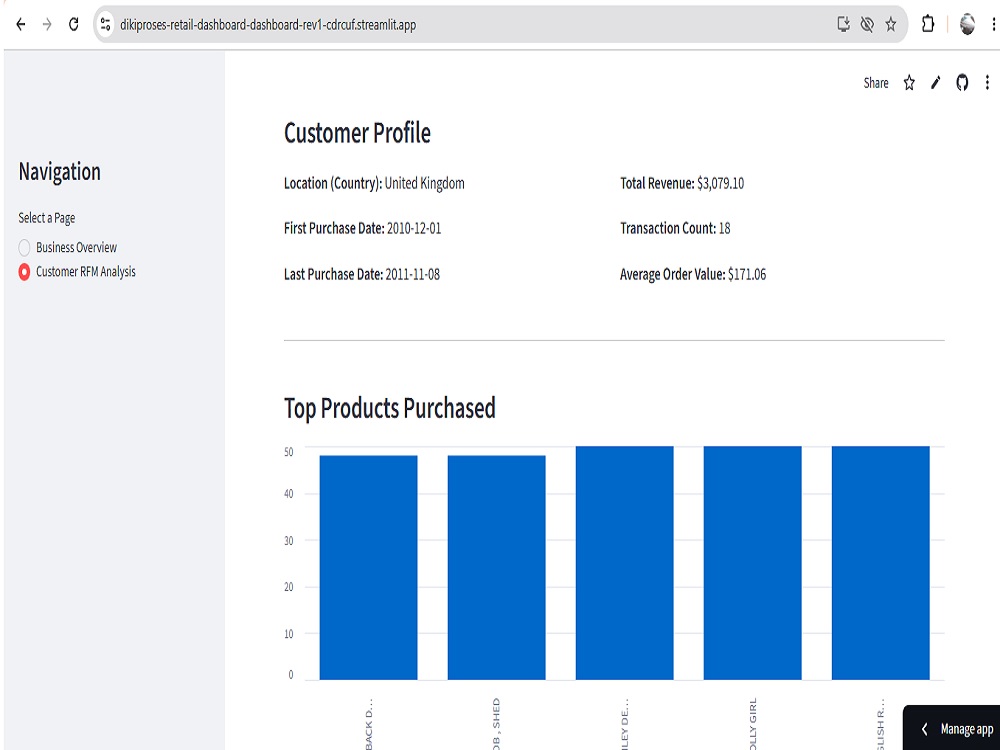
Advanced Analytics: Performing Customer RFM (Recency, Frequency, Monetary) analysis to identify VIPs, active buyers, and at-risk customers so you can tailor your marketing strategies.
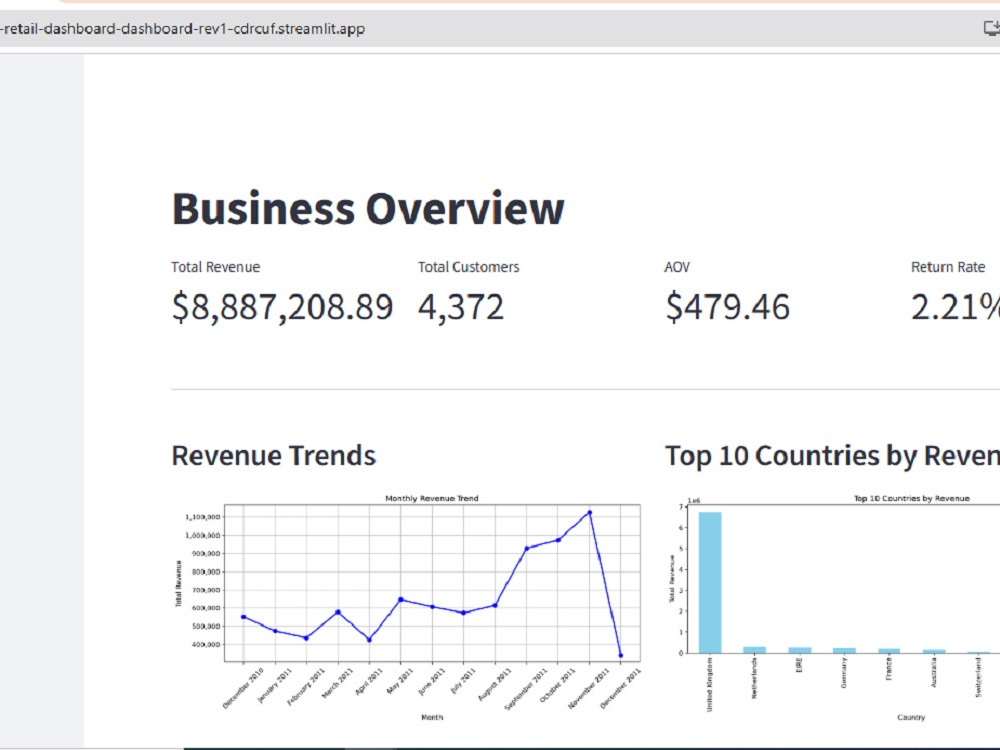
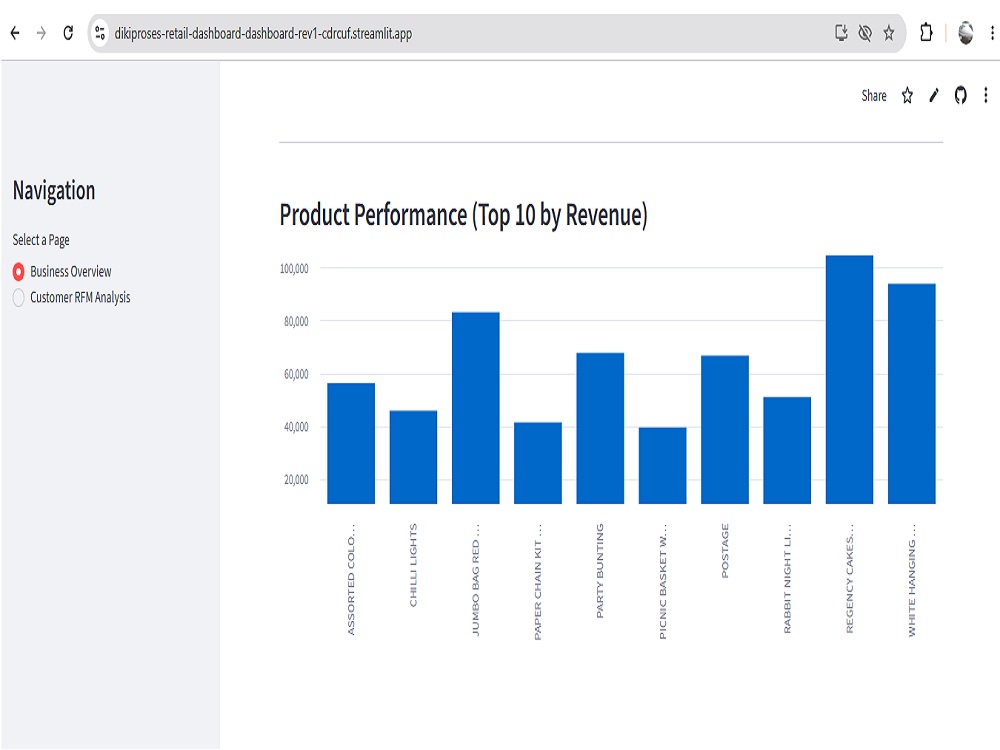
Interactive Dashboards: Developing responsive web apps with intuitive filters, KPI metrics (Revenue, AOV, Return Rates), and clear geographic/trend visualizations.
End-to-End Deployment: Seamlessly connecting repositories and hosting projects via cloud platforms so your dashboard is always live, secure, and ready to use.
My Core Tech Stack:
Language: Python
Data Manipulation: Pandas, NumPy
Data Visualization: Matplotlib, Seaborn
Web Framework: Streamlit
Deployment: Git, GitHub, Streamlit Community Cloud
Let’s collaborate to make your data work for you. Reach out today, and let's discuss how we can bring your project to life!
Curious to see my work in action? You can explore a live demo of my E-commerce Analytics Dashboard here: dikiproses-retail-dashboard-dashboard-rev1-cdrcuf.streamlit.app
Steps for completing your project
After purchasing the project, send requirements so Diki can start the project.
Delivery time starts when Diki receives requirements from you.
Diki works on your project following the steps below.
Revisions may occur after the delivery date.
Data Review & Cleaning
I will securely review your dataset, handle missing values, remove duplicates, and structure the data to ensure it is 100% ready for accurate analysis.
Dashboard Development
I will build the interactive dashboard, integrate the business logic (e.g., RFM segmentation), and create dynamic charts based on your goals.