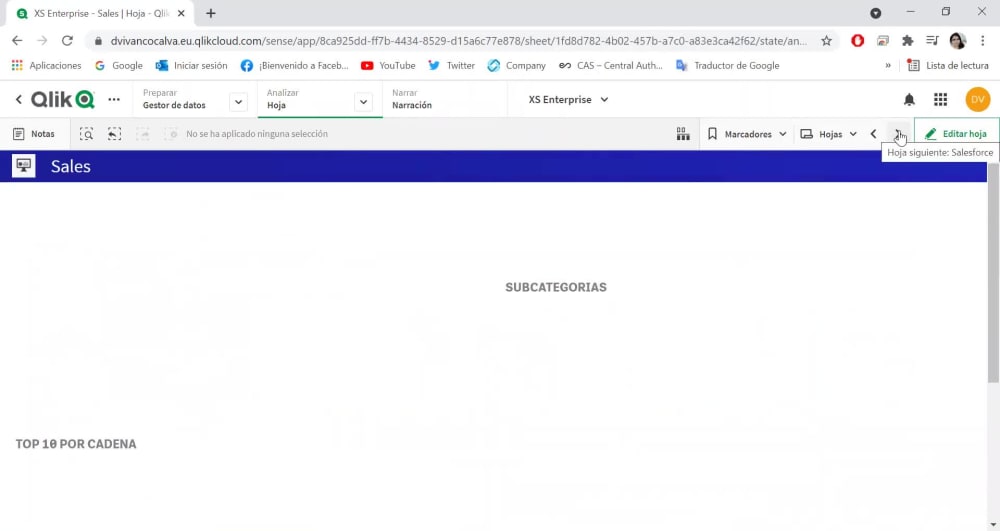
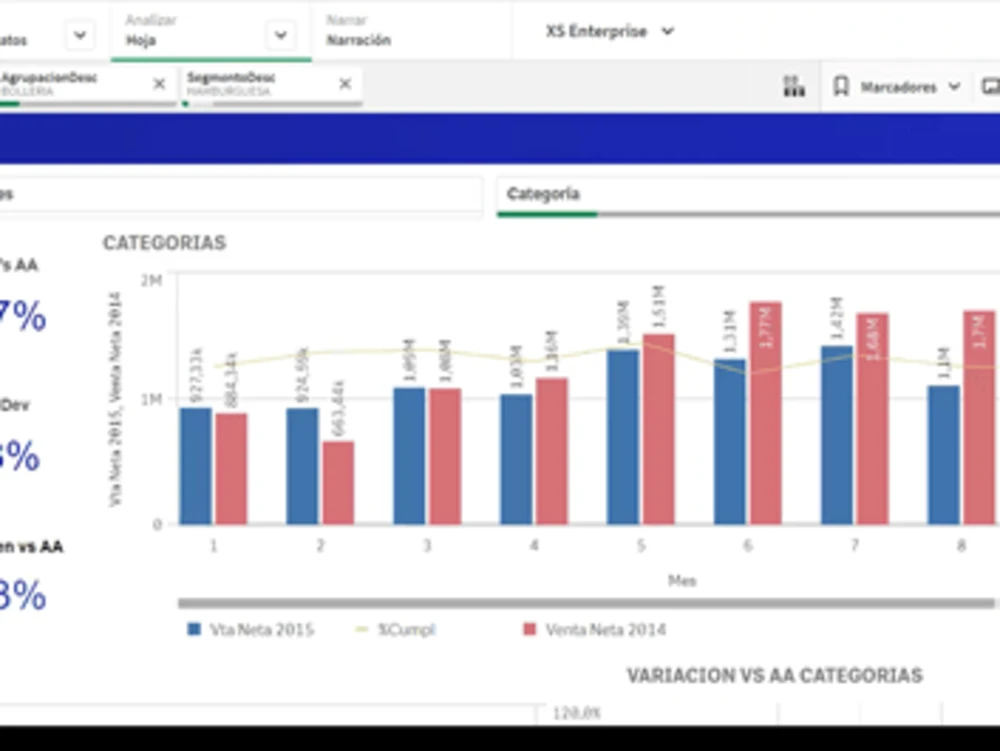
You will get Interactive Dashboards and KPI's using Qlik or PowerBI
Project details
I will transform your data to information quickly to analyze using tools like Qlik or Power BI, and KPI'S related to your business.
Data Tool
QlikViewWhat's included
| Service Tiers |
Starter
$40
|
Standard
$100
|
Advanced
$200
|
|---|---|---|---|
| Delivery Time | 2 days | 4 days | 7 days |
Number of Revisions | 2 | 3 | 4 |
Number of Graphs/Charts | 7 | 9 | 14 |
Number of Variations | 2 | 4 | 6 |
Data Source Connectivity | - | - | - |
Web Embedding | - | - | - |
Interactive/Animated Visuals | - | - | - |
Optional add-ons
You can add these on the next page.
Fast Delivery
+$50 - $300
Additional Revision
+$5
Additional Graph/Chart
(+ 1 Day)
+$5
Data Source Connectivity
(+ 1 Day)
+$10About Dayana
Senior Data Analyst
Kitchener, Canada - 6:48 pm local time
Skilled in data preparation, analysis and visualization, statistics, econometrics and business strategy, including knowledge of tools such as Python, SQL, R, PowerBI, Tableau, Stata and SPSS. I'm a professional oriented to results, proactive in search of continuous learning.
Steps for completing your project
After purchasing the project, send requirements so Dayana can start the project.
Delivery time starts when Dayana receives requirements from you.
Dayana works on your project following the steps below.
Revisions may occur after the delivery date.
Data Set
Client will deliver the differents data sets requiered to the project