You will get Interactive GIS Dashboards with real-time data
Project details
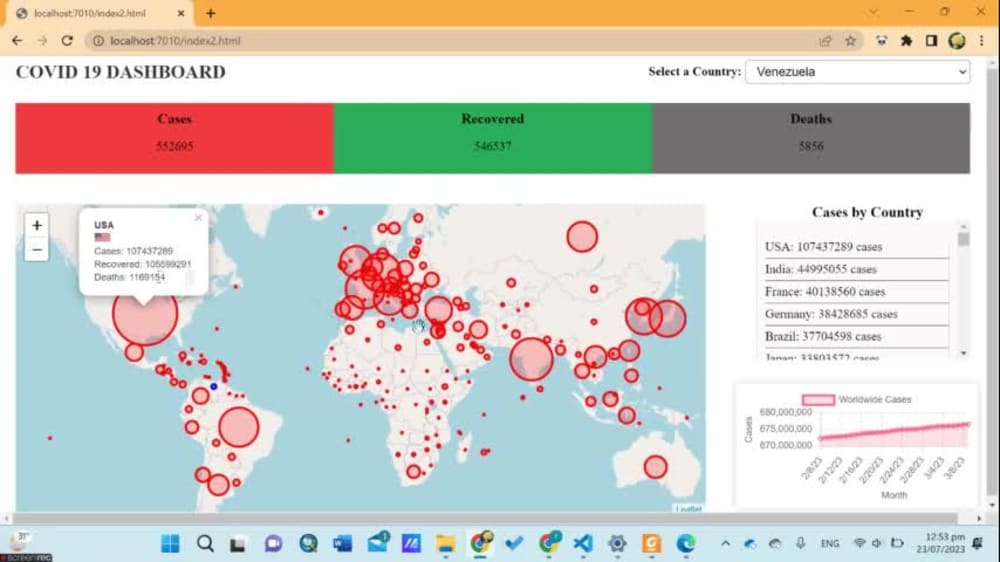
Interactive GIS dashboards allow users to visualize and interact with geographic information system (GIS) data in real time. These dashboards combine various data sources, such as maps, charts, tables, and other visualizations, to provide a comprehensive and dynamic view of spatial data.
What's included
| Service Tiers |
Starter
$100
|
Standard
$120
|
Advanced
$150
|
|---|---|---|---|
| Delivery Time | 7 days | 4 days | 3 days |
Number of Revisions | 3 | 3 | 3 |
Number of Graphs/Charts | 2 | 2 | 2 |
Number of Variations | 1 | 1 | 1 |
Data Source Connectivity | - | - | |
Web Embedding | - | - | |
Interactive/Animated Visuals | - | - |
Optional add-ons
You can add these on the next page.
Fast Delivery
+$20 - $50About Ayesha
RS and GIS ANALYST | WEB GIS Developer | ArcGIS Online | QGIS
Gujranwala, Pakistan - 10:48 pm local time
EXPERTISE
1. ARCMAP, ARCGIS PRO ERDAS IMAGINE, ECOGNITION, SNAP, QGIS, ArcGIS online
2. GIS mapping
3. Object image base and pixel based classification
4. Sentinel 1 preprocessing and mapping
5. LULC maps
6. Study area
7. Geospatial analysis
8. Esri StoryMaps
9. GIS Interactive Dashboards (HTML,CSS, Leaflet, javascript)
Steps for completing your project
After purchasing the project, send requirements so Ayesha can start the project.
Delivery time starts when Ayesha receives requirements from you.
Ayesha works on your project following the steps below.
Revisions may occur after the delivery date.
Dashboard
dashboards combine various data sources, such as maps, charts, tables, and other visualizations, to provide a comprehensive and dynamic view of spatial data.