Iva isn't taking new orders for this project right now. Here are some similar projects to explore.
You will get Real-Time Bike-Sharing Simulation & Interactive Map Dashboard

Project details
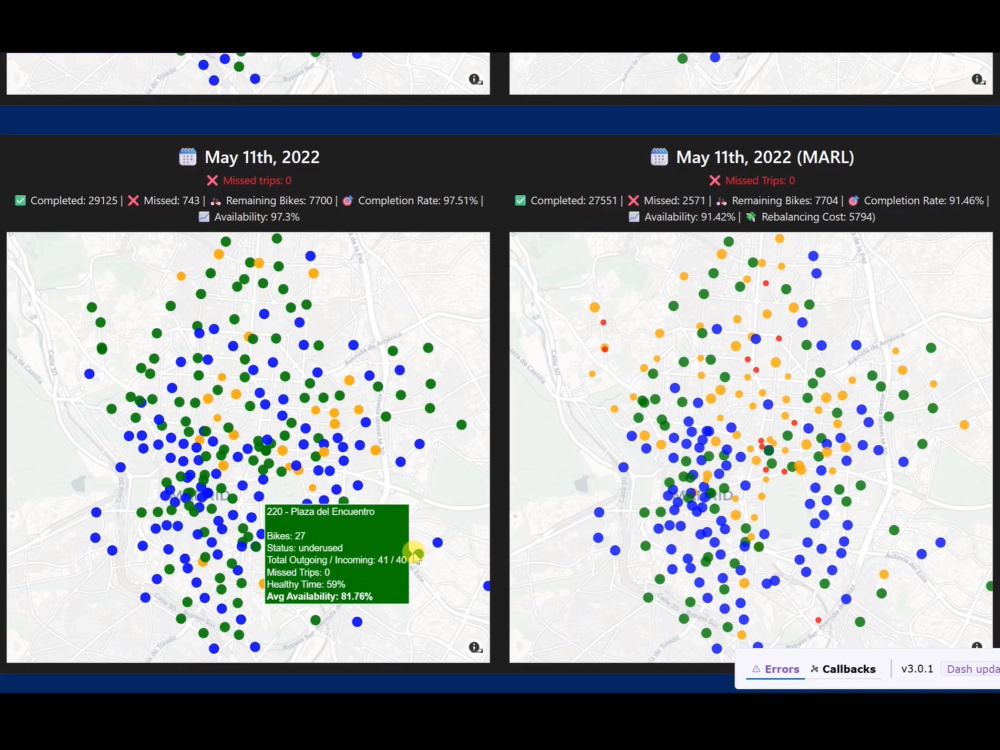
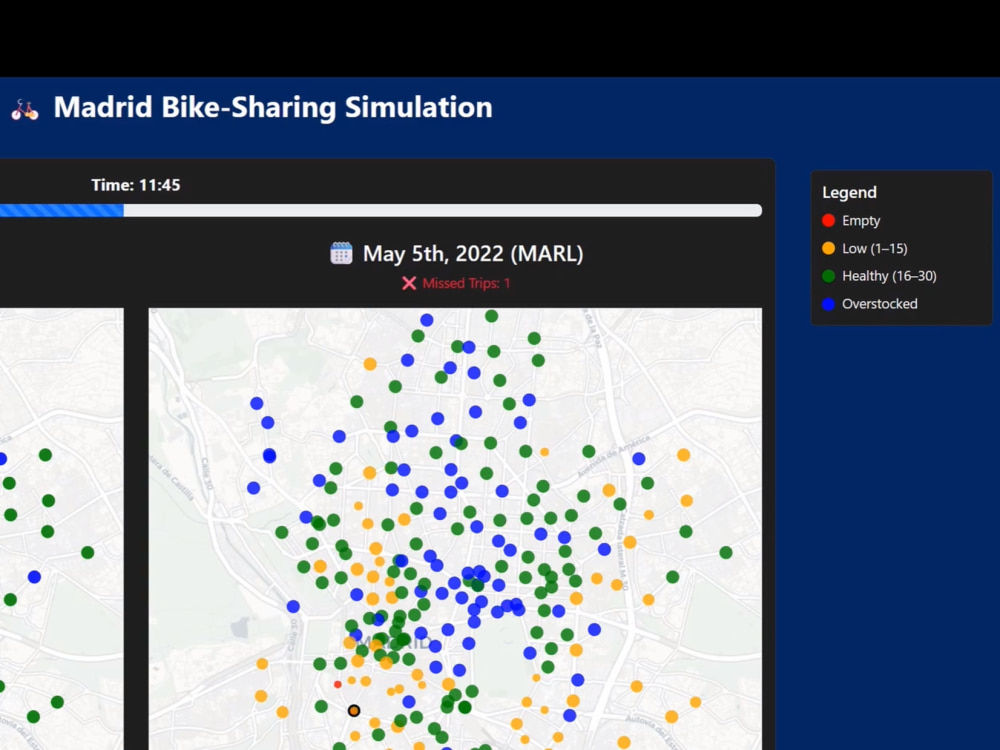
This project is an interactive, real-time dashboard that simulates bike-sharing activity in Madrid. Unlike static visualizations, it compresses a full day into a live 5-minute simulation, showing station activity, bike availability, and redistribution dynamics. I designed both the front-end interface and the simulation logic, applying intelligent decision-making to optimize bike distribution. Clients can explore how urban mobility systems can be visualized and managed efficiently. The work demonstrates my expertise in front-end development, UX/UI design, data visualization, and creating interactive, data-driven applications that solve real-world problems.
AI Development Type
Deep LearningAI Development Language
PythonWhat's included
| Service Tiers |
Starter
$120
|
Standard
$250
|
Advanced
$400
|
|---|---|---|---|
| Delivery Time | 3 days | 7 days | 10 days |
Number of Revisions | 1 | 1 | 2 |
AI Model Integration | - | - | |
Detailed Code Comments | |||
Knowledge Graph | - | - | - |
Model Documentation | - | ||
Ontology | - | - | - |
Source Code | |||
Taxonomy | - | - | - |
Frequently asked questions
About Iva
Data Engineer & Data Analyst | Python, SQL, ETL & Analytics
Varna, Bulgaria - 7:52 am local time
🚀 I specialize in turning raw, fragmented data into structured, high-quality datasets that are ready for reporting, analytics, dashboards, or machine learning applications.
Whether you need data extraction, cleaning, automation, or analytical reporting, I focus on delivering accurate, scalable, and well-documented solutions that save time and improve data quality.
What I deliver:
✅ Data extraction from websites, APIs, databases, and spreadsheets
✅ Data cleaning, validation, transformation, and preprocessing using Python and SQL
✅ ETL pipelines and automated data processing workflows
✅ Exploratory Data Analysis (EDA) and business insights
✅ Interactive dashboards and reports using Plotly Dash, Tableau, or Power BI
✅ Clear documentation and reproducible, maintainable code
Why work with me?
⭐ Strong attention to detail and data accuracy
⭐ Structured, organized workflows that are easy to maintain and extend
⭐ Clear and proactive communication throughout the project
⭐ Focus on scalable, reusable solutions rather than quick fixes
⭐ Analytical mindset with a problem-solving approach to every dataset
I also have experience building data-driven web applications with React, TypeScript, and Tailwind CSS, allowing me to create intuitive dashboards and user-friendly interfaces that make complex data easier to explore and understand when a frontend solution is needed.
💬 If you're looking for someone who can transform raw data into reliable insights—or build a clean interface to present them—I'd be happy to discuss your project.
— Iva Nikolova
Steps for completing your project
After purchasing the project, send requirements so Iva can start the project.
Delivery time starts when Iva receives requirements from you.
Iva works on your project following the steps below.
Revisions may occur after the delivery date.
Data processing and simulation setup
Preparing historical data and configuring simulation logic.
Front-end and UX/UI design
Creating interactive dashboards and map visualizations.