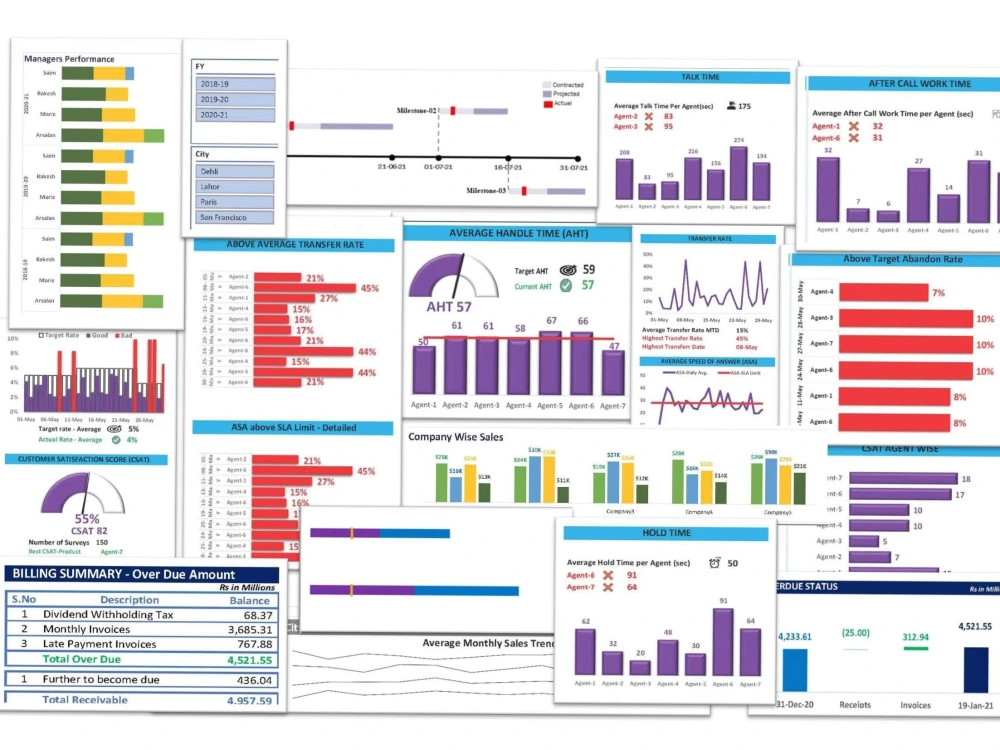
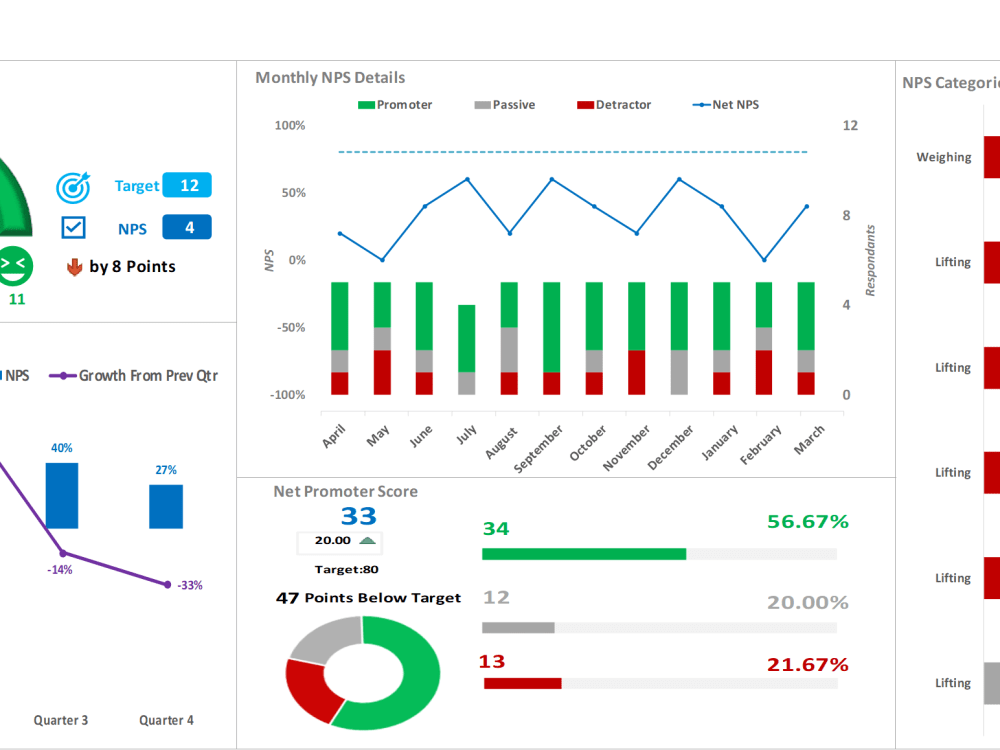
You will get Result Oriented Data Analysis | Graphs | Charts | Infographics | Tool Excel
Project details
✅Hi, I am an experienced professional in Data Analysis, Data Reports & Dashboard Designing, using Excel as a tool for 15 + years. I ensure you: ⭐ 100% Guaranteed Satisfaction ⭐ Timely Delivery ⭐ Best quality ⭐ On-going Availability ⭐ Reasonable Rates
✅ My Dashboards are
⭐ user-friendly and
⭐ easy to explain to stakeholders.
✅My Dashboards will help you in:
⭐ Understanding KPIs
⭐ Monitoring business performance
⭐ Decision Making for your business growth
✅ Connectivity of Excel Graphs, Charts with PowerPoint ⭐⭐⭐ Custom add-on
Moreover, you may go through my sample workings attached as "Portfolio" in Profile.
✅You will get Data Visualizations presented through:
⭐Pivot Table
⭐Slicers
⭐Spread Sheet Formatting
⭐Data Analysis
⭐Data Analytics
⭐Data Processing
⭐Charts & Graphs
⭐Conditional Formatting
⭐Sparklines
⭐Graphs & Charts
⭐Data Analysis
⭐Summaries
⭐Information Designing
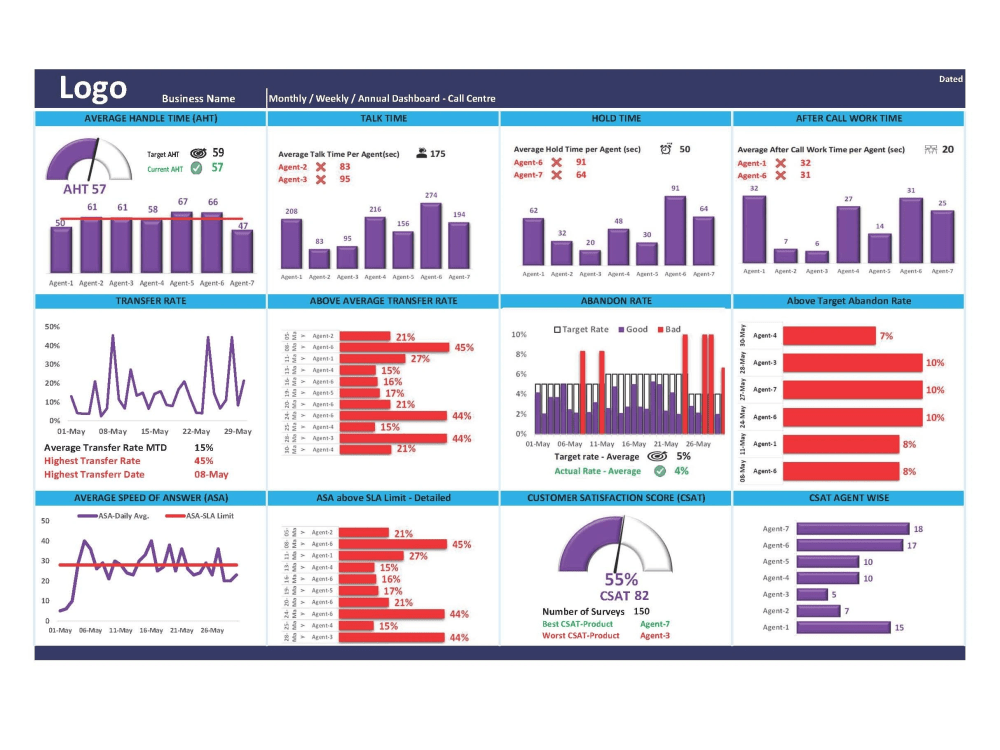
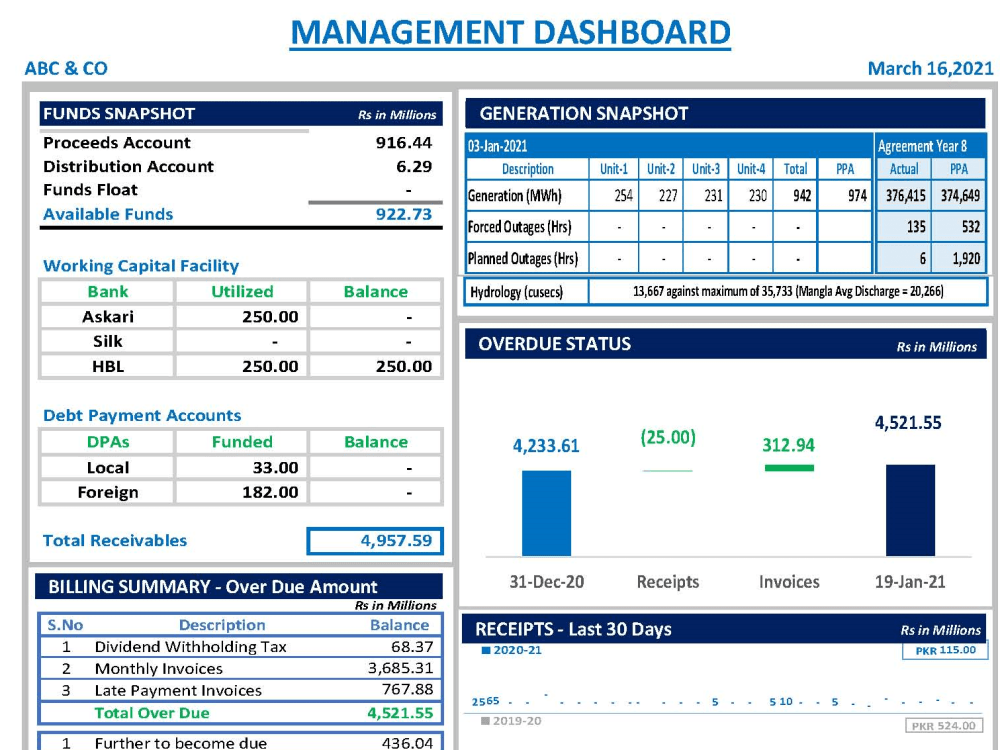
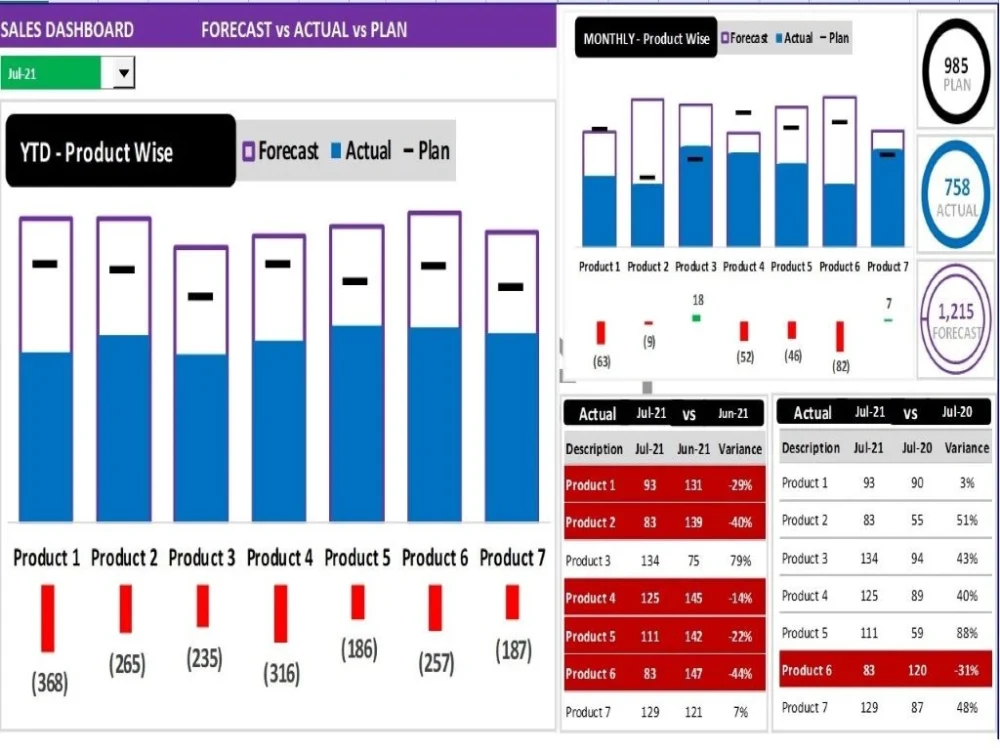
⭐KPI Dashboard and Reports
Best Regards,
Kamran
Masters in Business Administration (MBA)
Services & Expertise
Dashboard Designing in Excel | Data Visualization in Excel | Graphs & Charts in Excel | Infographics in Excel | Data Analysis in Excel | Data Formatting in Excel | Connect PowerPoint with Excel
✅ My Dashboards are
⭐ user-friendly and
⭐ easy to explain to stakeholders.
✅My Dashboards will help you in:
⭐ Understanding KPIs
⭐ Monitoring business performance
⭐ Decision Making for your business growth
✅ Connectivity of Excel Graphs, Charts with PowerPoint ⭐⭐⭐ Custom add-on
Moreover, you may go through my sample workings attached as "Portfolio" in Profile.
✅You will get Data Visualizations presented through:
⭐Pivot Table
⭐Slicers
⭐Spread Sheet Formatting
⭐Data Analysis
⭐Data Analytics
⭐Data Processing
⭐Charts & Graphs
⭐Conditional Formatting
⭐Sparklines
⭐Graphs & Charts
⭐Data Analysis
⭐Summaries
⭐Information Designing
⭐KPI Dashboard and Reports
Best Regards,
Kamran
Masters in Business Administration (MBA)
Services & Expertise
Dashboard Designing in Excel | Data Visualization in Excel | Graphs & Charts in Excel | Infographics in Excel | Data Analysis in Excel | Data Formatting in Excel | Connect PowerPoint with Excel
Project Type
Data Analysis, Development, Cybersecurity, Data Protection, IT, File Conversion, QA, User TestingWhat's included
| Service Tiers |
Starter
$200
|
Standard
$500
|
Advanced
$1,000
|
|---|---|---|---|
| Delivery Time | 2 days | 4 days | 7 days |
Number of Revisions | 3 | 5 | 9 |
Frequently asked questions
22 reviews
(22)
(0)
(0)
(0)
(0)
This project doesn't have any reviews.
MS
Mubeen S.
Jan 4, 2024
Reformulate Excel Data
Another outstanding job done! Looking forward to working with Kamran again in the future!
MM
Mabel M.
Nov 13, 2023
Survey Data Analysis
Kamran responded promptly and demonstrated a clear understanding of my requirements when I asked him to evaluate my survey responses. He delivered a thorough report that organized the data into a visual chart. I am highly satisfied with the communication and overall outcome.
FF
Finn F.
Oct 11, 2023
excel massage
i will always recommend this contractor to others :-)
MS
Mubeen S.
Jun 7, 2023
Excel spreadsheet reformat
It was a pleasure working with Kamran again. He completed the task on time and produced quality work!
MS
Mubeen S.
Dec 18, 2022
Excel spreadsheet reformat
Great work! Happy to work with him again on this new project!
About Kamran
I will build a custom bi solutions using google sheets and apps script
100%
Job Success
Rawalpindi, Pakistan - 2:54 pm local time
I design and develop custom Business Intelligence (BI) web applications, KPI systems and data visualization solutions using Google Workspace, Google Apps Script and modern web technologies.
I transform raw data into efficient workflows, actionable insights and automated interactive reporting systems that help businesses improve operational efficiency, enhance visibility and make faster, data-driven decisions.
The solution demo may be viewed at below link:
www datavsvalue com
BISolution Demo
Core Services:
- KPI Dashboards & Executive Reporting Systems
- Business Intelligence (BI) Solution
- Data Visualization & Analytics Solutions
- Sales & Performance Tracking Dashboards
- Workflow & Reporting Automation
- Custom Cloud-Based Dashboard Development
- Role-Based Secure Business Applications (RBAC)
Technology Stack:
- Google Sheets (Database Layer)
- Google Apps Script (Backend / API Layer)
- HTML5, CSS3, JavaScript (Frontend)
- Chart.js (Data Visualization)
- Google Workspace Integration
Key Features:
- Secure login & role-based access control
- Cloud-based scalable architecture
- Mobile & desktop responsive design
- Real-time data tracking dashboards
- Automated reporting systems
- Interactive charts & KPI metrics
Corporate Clients:
Some of the esteemed clients we have worked with include MPG Creative Group, Next Gen Cap, Hickory Solution 365, Premier Catering Manufacturing, Build & Launch University, Motive 3pl, Alpha Energy, Maxwell Welding & Machine Inc., and Sky Point Recovery.
Let's prepare your BI solution...
Best Regards,
Kamran Ali
Founder: DatavsValue
Steps for completing your project
After purchasing the project, send requirements so Kamran can start the project.
Delivery time starts when Kamran receives requirements from you.
Kamran works on your project following the steps below.
Revisions may occur after the delivery date.
Understanding Data & Requirements
Understanding of data and requirements is essential for successful and Timely Delivery of the Project.
Deliver Draft & Revisions
Draft working shall be shared and revision shall be made accordingly.