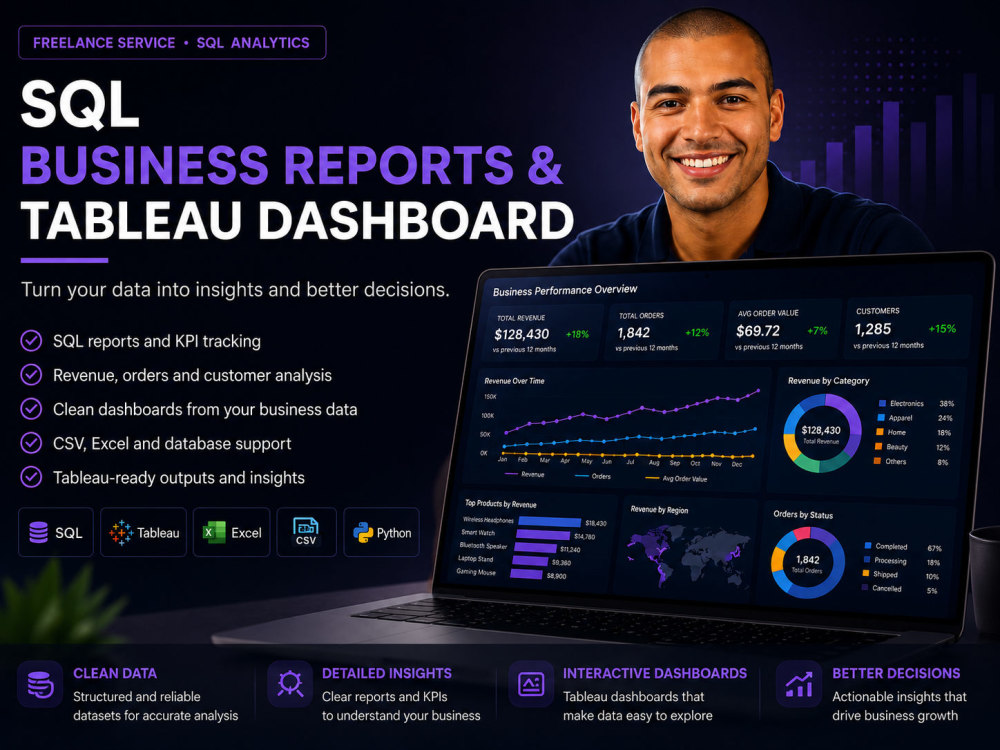
You will get SQL business reports and a Tableau dashboard from your data
Project details
I will transform your raw business data into clear SQL reports, KPI summaries and Tableau dashboards, I can work with CSV, Excel files or database exports and use SQL to clean, join, aggregate and analyze your data. The final result can include SQL queries, clean CSV outputs, business insights and an interactive Tableau dashboard. This project is ideal for businesses that need to understand revenue, orders, customers, products, payments, delivery performance or other key business metrics.
Data Tool
SQLWhat's included
| Service Tiers |
Starter
$35
|
Standard
$75
|
Advanced
$100
|
|---|---|---|---|
| Delivery Time | 3 days | 5 days | 7 days |
Number of Revisions | 1 | 2 | 3 |
Number of Graphs/Charts | 3 | 6 | 10 |
Number of Variations | 1 | 1 | 1 |
Data Source Connectivity | |||
Web Embedding | - | - | - |
Interactive/Animated Visuals | - |
Optional add-ons
You can add these on the next page.
Fast Delivery
+$30
Additional Revision
+$10
Additional Graph/Chart
+$10Frequently asked questions
1 review
(1)
(0)
(0)
(0)
(0)
This project doesn't have any reviews.
AU
Adriana U.
Jul 16, 2026
Marketing Data Analysis & Performance Report
Mattia is an extremely precise and kind person, I will collaborate with him again in the future
About Mattia
Data Analyst & ML | E-commerce Forecasting, Inventory, BI & Automation
Naples, Italy - 4:35 am local time
I help businesses transform raw data into actionable decisions using Data Analysis, Machine Learning, and Business Intelligence. With 7 years of experience in e-commerce operations, I understand the business impact behind stockouts, excess inventory, poor forecasting, and disconnected reporting.
🔹 MY SERVICES
• Data Analysis: Cleaning, validation, EDA, SQL reporting, and KPI analysis
• Forecasting: Time Series, Demand Forecasting, and Predictive Modeling
• Inventory: Safety Stock, Reorder Points, Inventory Optimization, and Replenishment
• Business Intelligence: Interactive Tableau and Power BI dashboards
• Machine Learning: Python, XGBoost, TensorFlow, and Neural Networks
• Automation: Automated data refresh and reporting pipelines
🔹 PROVEN PROJECT RESULTS
• Analyzed 4.5M+ retail records across 50 stores to generate demand forecasts and inventory-risk classifications
• Compared baseline, XGBoost, Dense Neural Network, and LSTM models to identify the most reliable forecasting approach
• Translated forecast uncertainty into Lean, Balanced, and Conservative inventory strategies through Tableau
• Built KPI reporting and data-quality analysis for e-commerce datasets
🔹 TECH STACK
Python | SQL | Excel | Tableau | Power BI | XGBoost | TensorFlow
My focus is not just creating models or dashboards, but turning data into clear, practical decisions that businesses can actually use.
Send me a brief description of your data and the decision you want to improve. I’ll identify the most effective analytical approach for your project.
Steps for completing your project
After purchasing the project, send requirements so Mattia can start the project.
Delivery time starts when Mattia receives requirements from you.
Mattia works on your project following the steps below.
Revisions may occur after the delivery date.
Review requirements and data
I will review your dataset, requirements, business questions and preferred deliverables.
Clean and prepare the data
I will organize the data, check the structure and prepare it for SQL analysis.