You will get Tableau data visualization to turn messy data into clear charts
Top Rated
Project details
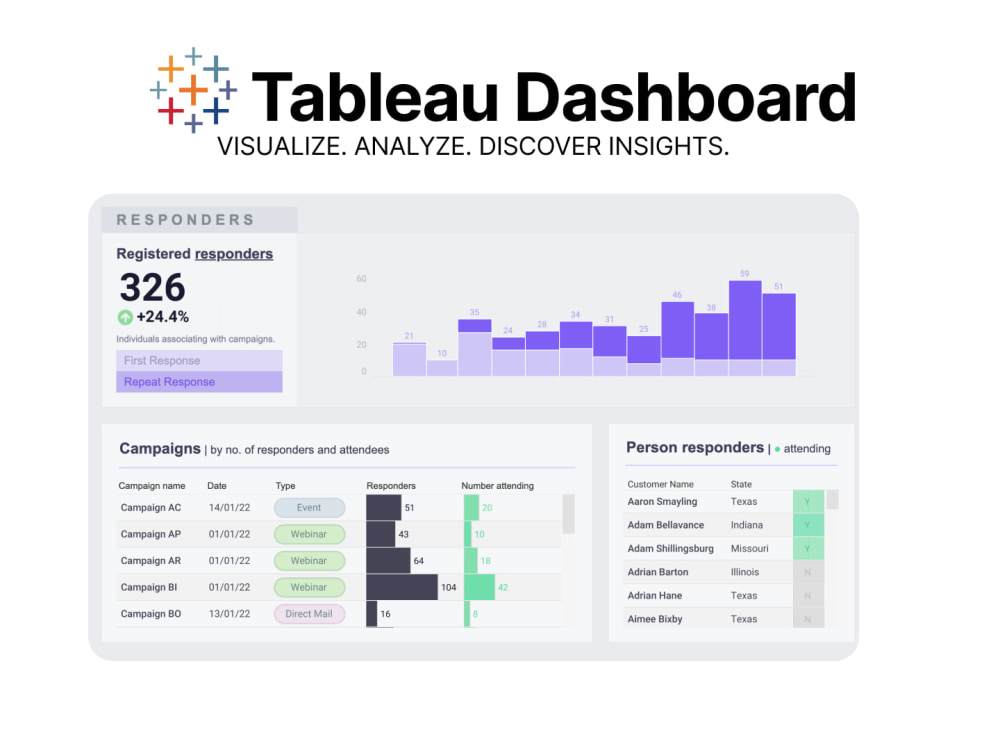
Tableau data visualization to turn messy data into clear charts so you can stop staring at spreadsheets and start understanding your business.
Staring at thousands of rows in Excel or a database is overwhelming. It is impossible to spot trends, identify dropping sales, or present findings to stakeholders when your data is just a wall of text. You need a way to communicate numbers instantly.
I specialize in taking raw, chaotic datasets and transforming them into stunning, highly accurate visual stories. Whether you need an interactive map for regional sales, a dynamic bar chart for quarterly revenue, or a clean line graph for future growth, I build visuals that demand attention.
I handle the heavy lifting. I will clean your data, format it properly, and design custom Tableau charts that perfectly match your company's branding and colors. Your final product will be a polished, professional asset ready for your next big presentation or internal report.
Please send me a message with a sample of your raw data before ordering. Let's make your numbers make sense.
Data Tool
TableauWhat's included
| Service Tiers |
Starter
$50
|
Standard
$120
|
Advanced
$350
|
|---|---|---|---|
| Delivery Time | 2 days | 3 days | 3 days |
Number of Revisions | 1 | 2 | 2 |
Data Source Connectivity | |||
Web Embedding | - | ||
Interactive/Animated Visuals | - | - | - |
Optional add-ons
You can add these on the next page.
Fast Delivery
+$50 - $90Frequently asked questions
89 reviews
(88)
(0)
(1)
(0)
(0)
This project doesn't have any reviews.
AI
Alberto I.
Jun 4, 2026
Moll Insurance Audit Sheet
SD
Salvador D.
May 26, 2026
Automate Sales Report Processing
Great job!
ND
Neal D.
May 21, 2026
Rate Calculator
This is the second job I have worked with Nazar on and both times the result has been top quality.
MH
Mike H.
May 13, 2026
Image processing and data extraction
Nazar was a pleasure to work with, he quickly understood the task and asked clarifying questions. He completed high quality results within the timeline and budget. He was willing to take on some extra tasks to help round the result out. I recommend Nazar and will engage him again if ever there is the chance.
CM
Claudia M.
Apr 29, 2026
Looker studio report modifications
Super fast delivery and very clean job!
About Nazar
Google Sheets, Apps Script & Dashboard Developer | Python, Tableau
100%
Job Success
Lviv, Ukraine - 9:20 am local time
If your business runs on Google Sheets (or you're escaping Excel), I make it run by itself. I'm Nazar — a Top Rated Google Sheets, Google Apps Script, and Python developer specializing in spreadsheet automation, web automation, data scraping, and reporting in Tableau and Looker Studio (Google Data Studio). Whether you need a complex Google Apps Script workflow, a live Tableau dashboard, or a Looker Studio report pulling from Google Sheets and SQL, I deliver clean, scalable solutions that save hours and drive better decisions.
WHAT I DO
- Google Apps Script automation: auto-send emails, generate PDF reports, sync data on a schedule, and connect Google Sheets to third-party APIs (OpenAI, Slack, CRMs, payment tools).
- Google Sheets development: inventory systems, CRMs, quoting and estimating calculators, and financial models built right inside Google Sheets.
- Tableau & Looker Studio dashboards: interactive Tableau and Looker Studio (Google Data Studio) dashboards pulling from Google Sheets, SQL, and APIs, so you decide on live data.
- Web automation & data scraping: Google Apps Script and Python scrapers that fetch, clean, and pipe web data straight into Google Sheets on autopilot.
- Excel to Google Sheets migration: complex Excel logic rebuilt as clean, cloud-based Google Sheets workflows.
- Fixing & optimizing: slow or broken Google Sheets and buggy Apps Script debugged, sped up, and made reliable.
- Formulas & data cleaning: advanced Google Sheets formulas, pivot tables, and structured, error-free data that performs fast.
REAL RESULTS (what I did then what the client got)
- Built a Google Apps Script automation that replaced hours of copy-paste, so the client got 80%+ less manual data entry and a team that scaled without new hires.
- Designed Tableau and Looker Studio dashboards on top of their Google Sheets, so the client got a 20% jump in operational efficiency by exposing bottlenecks they couldn't see before.
- Wired real-time PPC reporting into a Looker Studio (Google Data Studio) dashboard, so the client got 30% better ad ROI.
- Built an Apps Script and Python data scraping pipeline, so the client got live market data flowing into Google Sheets every day with zero manual work.
- Automated weekly reporting with Google Apps Script feeding a Looker Studio dashboard, so the client got their numbers in minutes instead of a full day.
- Connected Google Sheets to the OpenAI and Slack APIs with Apps Script, so the client got AI-enriched data and instant team alerts without lifting a finger.
- Rebuilt a tangled Excel model as a Google Sheets system with Apps Script, so the client got reporting that was faster, shareable, and finally accurate.
WHO I WORK WITH
Founders, operations teams, marketing agencies, ecommerce stores, and finance teams who live in Google Sheets and need Apps Script automation, Tableau or Looker Studio dashboards, or web data scraping that just works — whether it's a one-off fix or an ongoing build.
RECENT PROJECTS
Google Sheets inventory systems; automated CRMs in Google Apps Script; Tableau & Looker Studio (Google Data Studio) reporting; quoting and estimating calculators; Apps Script and Python web scrapers and data fetchers; Google Sheets API connectors (OpenAI, Slack, and more); and end-to-end web automation workflows.
TOOLS
Google Sheets, Google Apps Script, JavaScript, Python, Tableau, Looker Studio (Google Data Studio), SQL, Microsoft Excel, Google Workspace, and the Google Sheets API.
WHY ME
Top Rated, with a track record of clean, scalable code and clear communication. I don't just write a quick Apps Script and disappear — I build Google Sheets and Tableau/Looker Studio solutions you don't have to babysit, and I document everything so your team can run with it.
HOW I WORK
I scope the real problem first, then build the Google Sheets automation, Apps Script workflow, web scraper, or Tableau/Looker Studio dashboard around it. Most projects start with a quick call so I understand your data before I touch it, and I keep you updated at every step, with fast replies and clear timelines.
Ready to turn your Google Sheets into your most valuable business asset? Whether it's Google Apps Script automation, a Tableau or Looker Studio (Google Data Studio) dashboard, web automation, or data scraping, message me with what you're trying to build and I'll tell you exactly how I'd approach it.
Steps for completing your project
After purchasing the project, send requirements so Nazar can start the project.
Delivery time starts when Nazar receives requirements from you.
Nazar works on your project following the steps below.
Revisions may occur after the delivery date.
Clean and prepare the data
I will review your raw data files, fix any formatting issues, and structure the data so it is perfectly ready for accurate visualization.
Design the custom visuals
I will build the specific Tableau charts and graphs, applying your brand colors to make the information clear, engaging, and easy to read.