You will get the best econometric models designs and machine learning solutions
Top Rated
Project details
I will help you analyze your data with econometric and machine learning techniques.
Among the econometric methods, we cover the following topics:
* Event Studies - Gravity Model - Difference in Differences Estimation
* Unit root test
* Arima models
* Volatility models - Arch, Garch, Egarch, Smooth-transition garch, and mgarch.
* Autoregressive vector models (VAR), structural VARs, and Fractional autoregressive models.
* Cointegration
* Dynamic regression -Autoregressive distributed lags model (ARDL)
* Panel Data Models: Fixed and random effects, instrumental variables, GMM, SURE, MG, PMG. Cointegrated panel. Panel VAR.
Among the machine learning techniques, we cover the following:
* Classification using decision trees and logistic regression
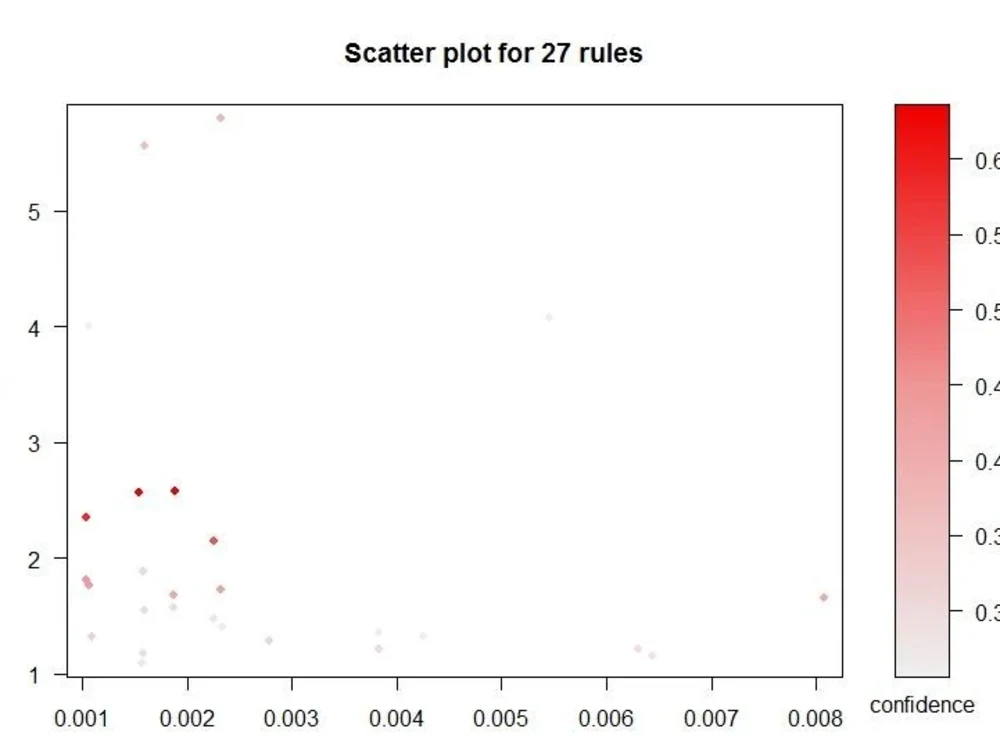
* Association rules
* SVM
* Neural networks
* Cluster analysis
* Mining opinions with Twitter
Tools: R, STATA, Eviews, SPSS, Python, Tableau.
Among the econometric methods, we cover the following topics:
* Event Studies - Gravity Model - Difference in Differences Estimation
* Unit root test
* Arima models
* Volatility models - Arch, Garch, Egarch, Smooth-transition garch, and mgarch.
* Autoregressive vector models (VAR), structural VARs, and Fractional autoregressive models.
* Cointegration
* Dynamic regression -Autoregressive distributed lags model (ARDL)
* Panel Data Models: Fixed and random effects, instrumental variables, GMM, SURE, MG, PMG. Cointegrated panel. Panel VAR.
Among the machine learning techniques, we cover the following:
* Classification using decision trees and logistic regression
* Association rules
* SVM
* Neural networks
* Cluster analysis
* Mining opinions with Twitter
Tools: R, STATA, Eviews, SPSS, Python, Tableau.
Data Tool
RWhat's included
| Service Tiers |
Starter
$100
|
Standard
$300
|
Advanced
$500
|
|---|---|---|---|
| Delivery Time | 5 days | 7 days | 10 days |
Number of Revisions | 1 | 2 | 3 |
Number of Graphs/Charts | 3 | 5 | 7 |
Number of Scenarios | 1 | 1 | 2 |
Model Documentation | |||
Data Source Connectivity | - | - | - |
Model Validation/Testing | - | - |
Optional add-ons
You can add these on the next page.
Report
+$100Frequently asked questions
17 reviews
(16)
(1)
(0)
(0)
(0)
This project doesn't have any reviews.
AK
AL K.
May 2, 2025
Improving models
As always he is perfect person, did his work on time and perfect
AK
AL K.
Jan 14, 2025
Improving work section
Ruben, as always, finished the work perfectly and amazingly. Thank you, Ruben.
AK
AL K.
Nov 24, 2024
Review works
AK
AL K.
Nov 11, 2024
Hybrid TFT
AK
AL K.
Nov 11, 2024
Improved economy paper with anlysis
About Ruben
Data Scientist (Expert Level)
100%
Job Success
Caracas, Venezuela - 7:14 pm local time
Seller: Ruben Ibarra ( PhD in Statistics - Mathematician - Econometrician, ML/DL)
________________________________________
1) SERVICE OVERVIEW
I help businesses and researchers turn raw data into reliable predictions and actionable insights. I specialize in hybrid time‑series forecasting, Machine Learning, and Deep Learning, delivering reproducible code, clear documentation, and business‑ready artifacts.
INDUSTRIES: Finance, energy, retail, manufacturing, climate, health/sensor analytics.
TOOLING: Python (NumPy, Pandas, scikit‑learn, XGBoost/LightGBM/CatBoost), Optuna, SHAP, Statsmodels (ARIMA/SARIMAX/GARCH), PyTorch/TensorFlow, Signal Processing (Welch/STFT/DWT), RAPIDS (GPU), SQL.
________________________________________
2) CORE OFFERS (Pick one or combine)
A. TIME-SERIES FORECASTING & CAUSALITY
• Forecasting: ARIMA/SARIMAX, VAR/TVP‑VAR, GARCH, Prophet, LSTM/GRU, hybrid ensembles
• Feature engineering: calendar/events, weather, promotions, wavelets (DWT), STFT/Welch PSD
• Multi‑horizon & hierarchical forecasts; nowcasting; anomaly detection
• Causal/exposure indices: PCA/LDA‑based indices, synthetic control (classic & stacked)
Deliverables: Clean repo + notebooks, forecast charts, error diagnostics (MAE/MAPE/RMSE), MLOps‑ready pipeline options
B. MACHINE LEARNING & DEEP LEARNING
• Classification & regression (XGBoost/LightGBM/CatBoost, RF, SVM)
• MLP, RNN, CNN, LSTM, GRU, and Temporal Fusion Transformer (TFT)
• Predictive Maintenance ( Manual feature engineering or Architectures like PatchTST and
MOMENT)
• Imbalance handling, cross‑validation, calibration, SHAP interpretability & pruning
• Hyperparameter optimization with Optuna
Deliverables: Feature store, tuned model, test metrics (AUC/F1/PR), explainability report
________________________________________
3) PACKAGES (scope guidance — can be tailored)
🚀 STARTER (MVP/Exploratory)
• Scope: One dataset, single target; baseline + 1 advanced model
• Work: EDA, baseline, tuned model via Optuna (≤ 30 trials), basic report
• Data limit: ≤ 200 MB, ≤ 2M rows (tabular) or ≤ 12 series (time‑series)
• Deliverables: Notebook + brief PDF, predictions CSV, code repo
• Timeline: ~5–7 days
⚖️ ADVANCED (Production‑ready Model)
• Scope: Multiple series/segments, feature engineering, ensembling
• Work: Robust CV, diagnostics, SHAP report, data leakage checks, error analysis
• Add‑ons included: Experiment tracking, reproducible environment (requirements.txt)
• Deliverables: Modular repo, metrics dashboard (static), handover call notes
• Timeline: ~10–14 days
🧭 END TO END (Pipeline + Handoff)
• Scope: Full pipeline with scheduled scoring; optional API/batch
• Work: CI-friendly structure, model monitoring hooks, documentation & SOPs
• Deliverables: Repo + README, config files, deployment guide; optional API stub
• Timeline: ~2–4 weeks
Notes: Pricing varies based on data volume, complexity, and compliance/security requirements. I’m happy to provide a fixed-price quote if you require one.
4) WHAT YOU GET (Deliverables)
• Clean, versioned Git repository (readable modules + notebooks)
• Report (PDF/Markdown): methods, metrics, plots, decisions
• Forecasts/Predictions CSV/Parquet; optional dashboards
• Reproducibility: lockfiles/requirements, random seeds, data schema
• Explainability: SHAP plots, feature importance, ablations
________________________________________
5) BUYER REQUIREMENTS (intake form)
Please provide: - Objective & KPIs (e.g., MAPE ≤ 10%, AUC ≥ 0.85) - Brief business context (drivers, constraints, decisions tied to model) - Data dictionary + sample dataset (schema, nulls, freq, units) - Historic range & granularity; expected forecast horizon - Non‑functional: latency, privacy, on‑prem vs. cloud, preferred stack - Compliance/IP constraints; NDA if required.
________________________________________
6) FAQ (buyer‑facing)
Q. Can you work under NDA and keep IP private? Yes. All code/data remain confidential; IP transfer occurs upon final payment.
Q. What accuracy can you guarantee? I don’t guarantee a specific metric before seeing data, but I provide baseline + target KPI ranges after EDA, and iterate to hit agreed thresholds.
Q. Do you support long‑term maintenance? Yes—retainers or milestone‑based updates are available.
Q. Can you deploy to my stack? I can provide API/batch stubs and DevOps‑ready instructions; direct deployment available on request.
I look forward to hearing from you
Best Regard
Steps for completing your project
After purchasing the project, send requirements so Ruben can start the project.
Delivery time starts when Ruben receives requirements from you.
Ruben works on your project following the steps below.
Revisions may occur after the delivery date.
1. Set your requirements
I prefer to initially review the data and literature on which your work is based, so that I can have a clearer idea of the complexity of the project, to establish the methodology to be used and the appropriate work plan.
2. Choose a level of service
Establish the appropriate level of service to your requirement.