You will get Interactive Survey Dashboard – Likert Scale Analysis for Strategic Planning
Top Rated
Top Rated
Project details
You'll get a custom-built interactive dashboard that transforms your survey responses—especially Likert scale data—into clear, actionable insights.
This service is ideal if you want more than a spreadsheet: I analyze correlations, segment respondents, and reveal patterns that help you make strategic decisions based on real data.
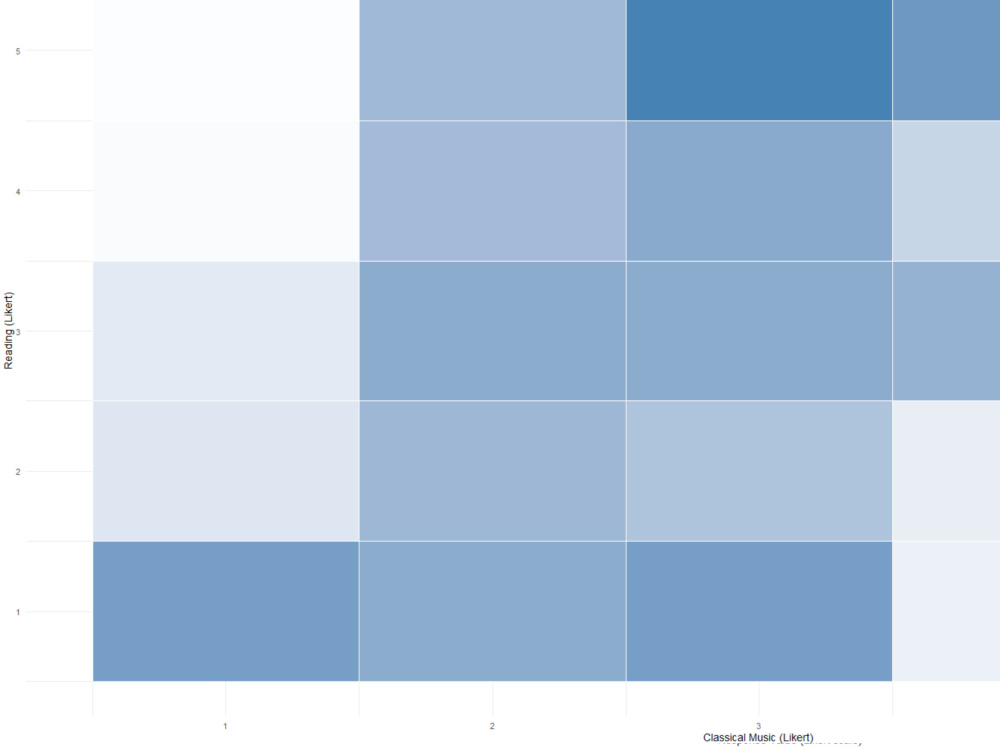
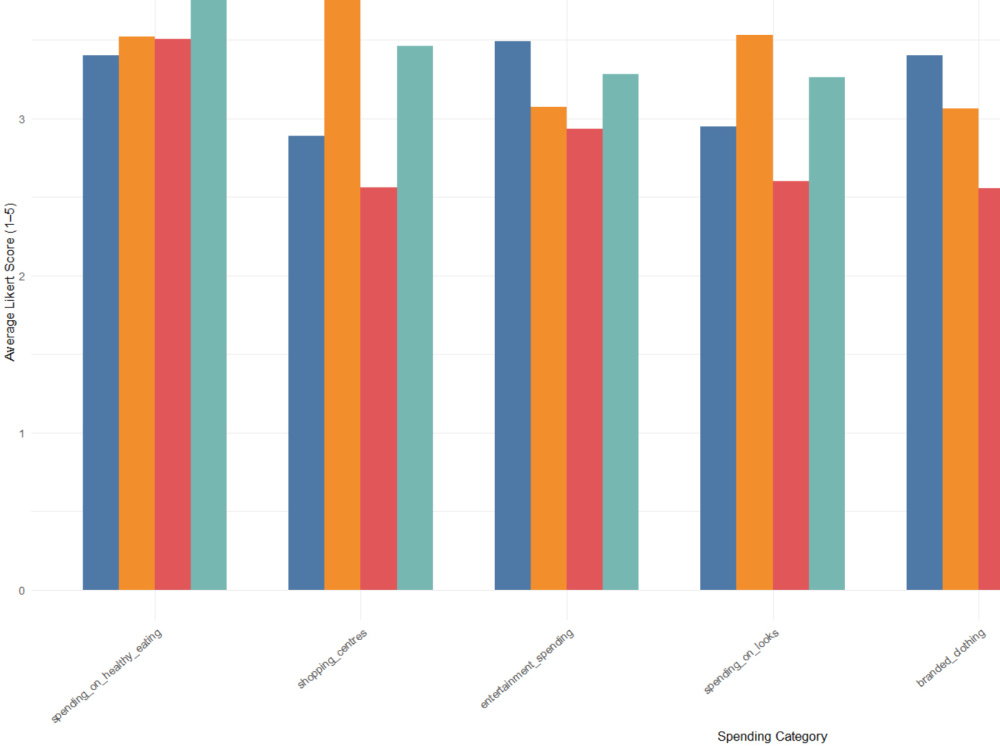
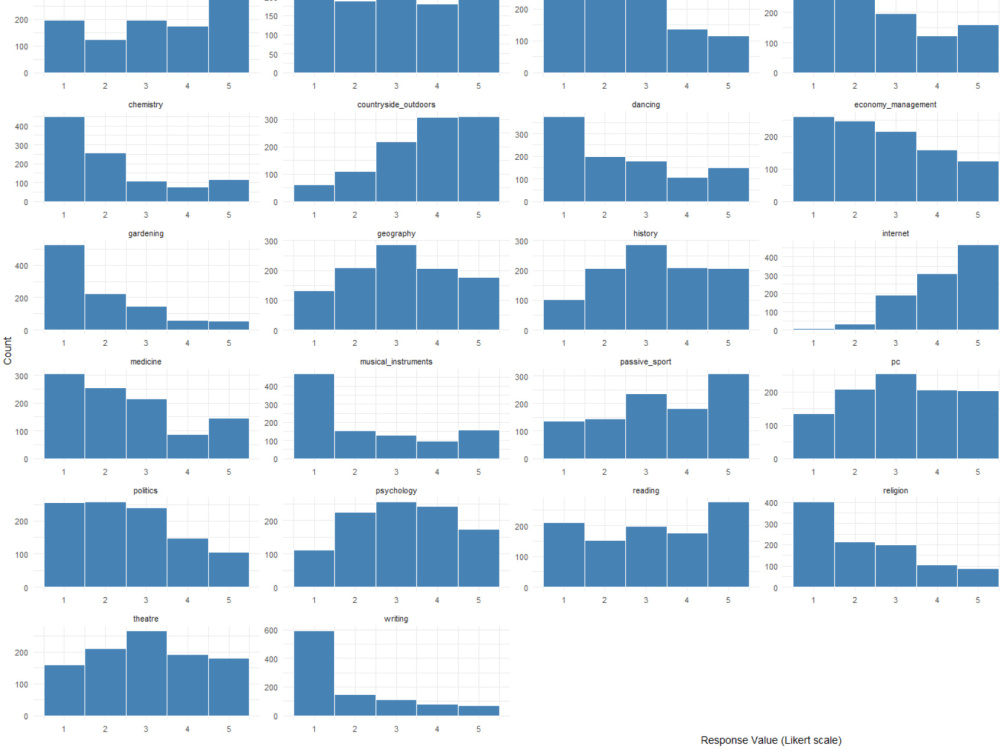
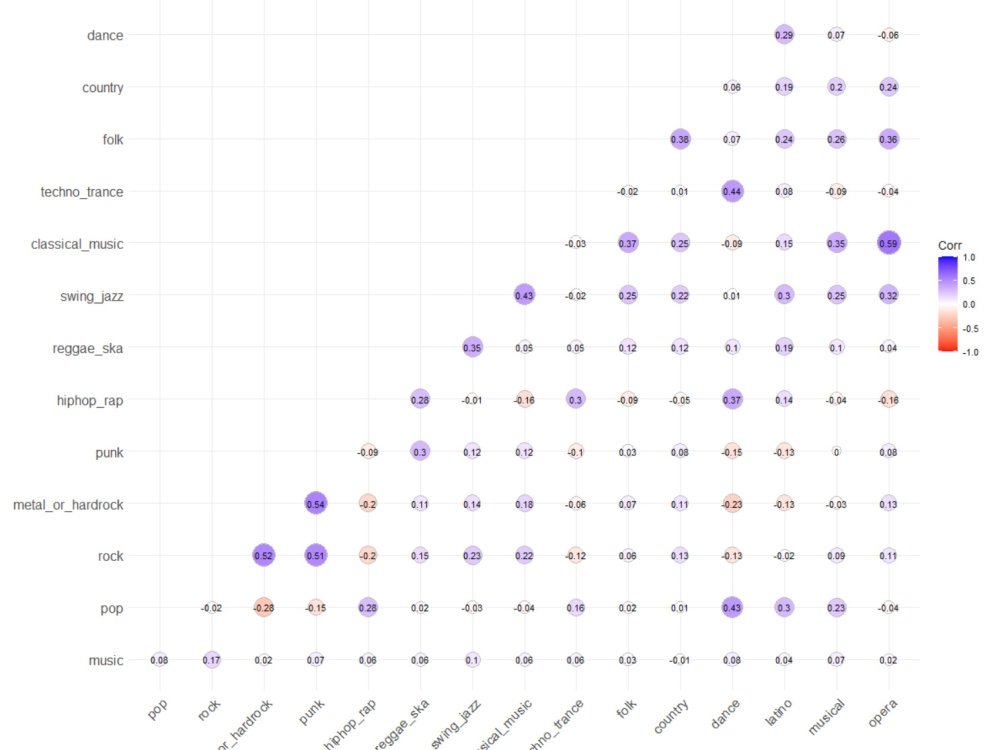
My dashboards are built using R Shiny and ggplot2 for a smooth, professional experience. Visuals include heatmaps, response distributions, customer segments, and behavioral clusters.
This is based on a real-world case with anonymized data, where we supported the launch strategy of a shopping center by analyzing young residents' habits and preferences.
This service is ideal if you want more than a spreadsheet: I analyze correlations, segment respondents, and reveal patterns that help you make strategic decisions based on real data.
My dashboards are built using R Shiny and ggplot2 for a smooth, professional experience. Visuals include heatmaps, response distributions, customer segments, and behavioral clusters.
This is based on a real-world case with anonymized data, where we supported the launch strategy of a shopping center by analyzing young residents' habits and preferences.
Survey Platform
OtherSurvey Type
Info Gathering, OpinionWhat's included
| Service Tiers |
Starter
$100
|
Standard
$300
|
Advanced
$500
|
|---|---|---|---|
| Delivery Time | 3 days | 5 days | 7 days |
Number of Respondents | 200 | 500 | 1000 |
Number of Questions | 15 | 30 | 50 |
Insights Summary | |||
Deep Analysis | - | ||
Free Text Analysis | - | - | |
Visualize Results |
Frequently asked questions
6 reviews
(6)
(0)
(0)
(0)
(0)
This project doesn't have any reviews.
IR
Ishtiaq R.
Jan 15, 2026
Data visualization with CRM data
The help I received was many times beyond my expectations. Dolores helped bring my broad vision into reality with detailed technical knowledge. I had many pivots along the way, and she adapted to those quickly. The quality of the deliverable was production-ready.
AR
Assaf R.
Nov 26, 2025
R Shiny Interface - Data Analysis Project
We had an excellent experience working with Dolores. She was highly responsive, attentive to our needs, and consistently communicative throughout the project. Everything was handled professionally and with a genuinely pleasant attitude. We’re very satisfied with the service she provided and would be happy to work with her again.
IS
Ivona S.
Sep 1, 2025
Curate Places of Interest in mapping services
Job well done. Good communication and understanding. Highly recommend!
LH
Lauri H.
Jul 4, 2025
Create an easy to read Spreadsheet and graph
Dolores was timely and worked completely independently without needing help from me. She produced exactly what I needed.
JJ
John J.
Jun 25, 2025
Excel Data Cleaning Specialist Needed
Dolores was extremely skilled in Excel and made my data extremely usable. She makes sure the objectives are clear and delivers a job that exceeds expectations! Looking forward to working with her again.
About Dolores
R Shiny Developer & Data Analyst | Reporting Automation | SQL
100%
Job Success
Murcia, Spain - 2:35 am local time
I usually get involved when totals do not match, KPI definitions are unclear, or reporting depends on repetitive manual work.
My work includes:
* multi-source data integration
* data validation and reconciliation
* KPI and reporting logic checks
* reporting automation
* data cleaning and standardization
* R/Shiny analytical applications
* reproducible workflows and documentation
Main tools: R, Shiny, SQL, tidyverse, R Markdown, Excel, REST APIs, CSV/JSON and Git.
Recent work includes integrating and validating more than 59,000 appointments and 54,000 patient records for a multi-location US dental group, building a multi-bank reconciliation workflow with configurable matching rules, and consolidating multi-year real estate data into clear comparative reporting for business decision-making.
I document assumptions, validation rules and unresolved issues so the workflow can be reviewed, maintained and updated later.
Steps for completing your project
After purchasing the project, send requirements so Dolores can start the project.
Delivery time starts when Dolores receives requirements from you.
Dolores works on your project following the steps below.
Revisions may occur after the delivery date.
Review and understand your survey data
I’ll examine the dataset structure, type of questions (especially Likert scale), and identify key variables to analyze.
Clean, process & explore the data
I’ll clean the data, handle missing values, and run exploratory analysis to detect relevant patterns and correlations.