You will get Data Analyst, Data Cleaning, Data Visualization and Advanced Excel, Python

Project details
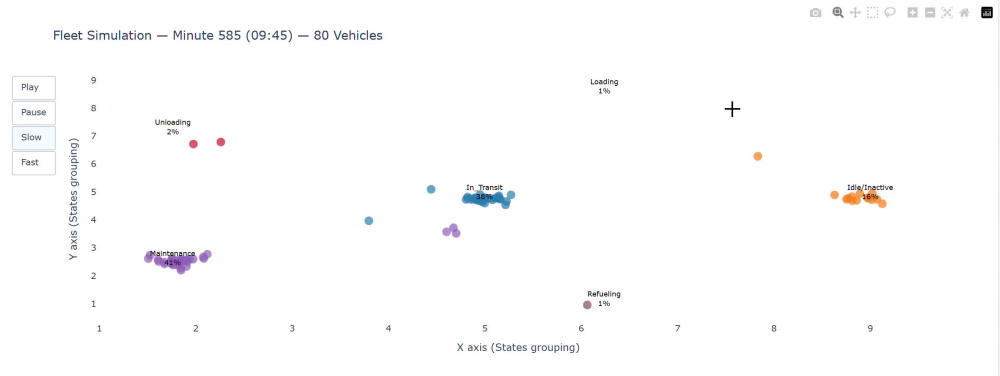
I'm Juan, a Mining and Metallurgical Engineer with strong experience in data analysis for earthworks, civil engineering, mining projects, and research initiatives. I also have advanced expertise in creating interactive dashboards with Plotly and developing animated charts that bring data to life. I’m passionate about turning complex information into actionable insights and engaging visual stories. Feel free to reach out if you’d like to discuss your project—I’ll be glad to help!
✔Customized work tailored to your specific requirements
✔Charts and Graphs
✔Reports and Dashboards
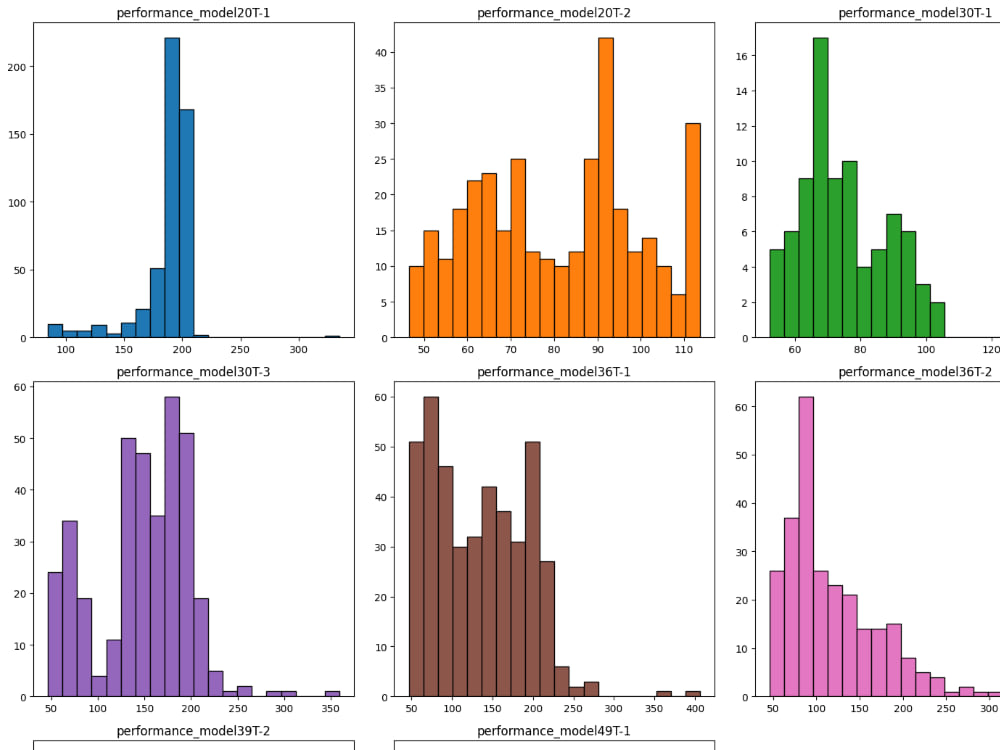
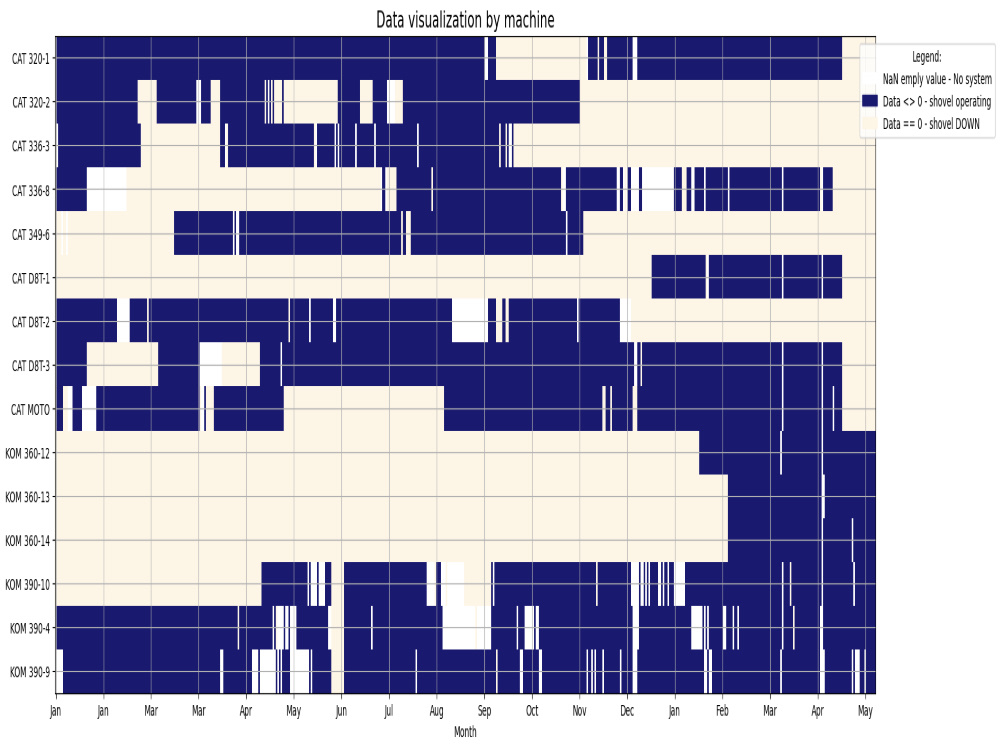
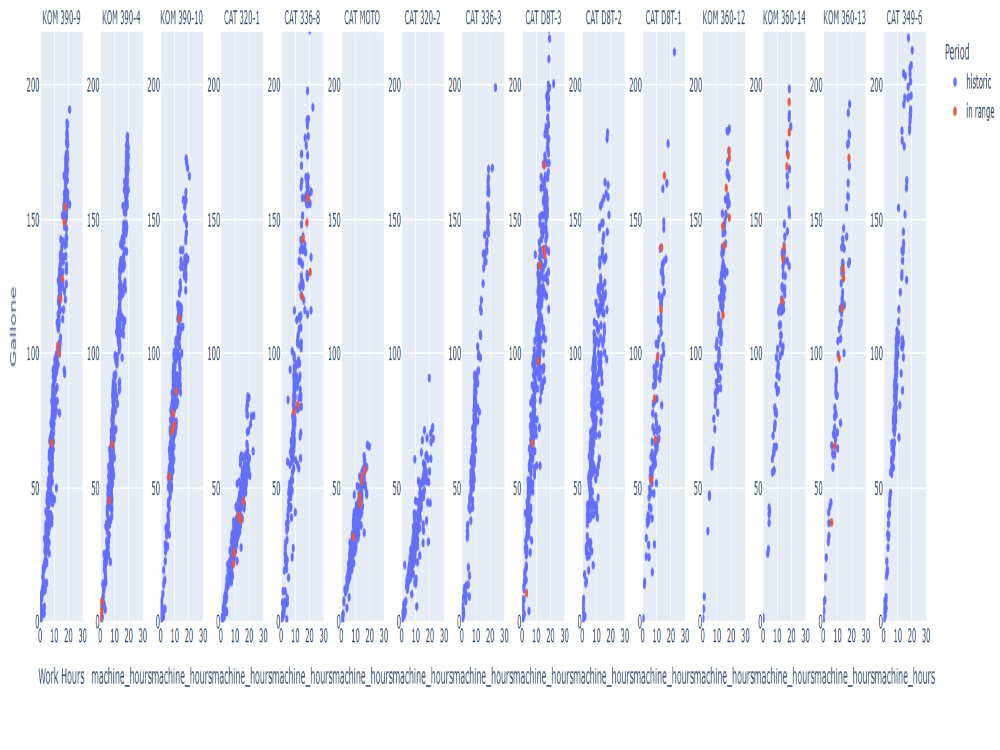
✔Python Data analysis
✔Data Formatting
✔Data Cleaning
✔Data insighs
✔Customized work tailored to your specific requirements
✔Charts and Graphs
✔Reports and Dashboards
✔Python Data analysis
✔Data Formatting
✔Data Cleaning
✔Data insighs
Data Tool
PythonWhat's included
| Service Tiers |
Starter
$10
|
Standard
$40
|
Advanced
$100
|
|---|---|---|---|
| Delivery Time | 1 day | 2 days | 5 days |
Number of Revisions | 0 | 2 | 3 |
Optional add-ons
You can add these on the next page.
Number of Graphs/Charts
(+ 1 Day)
+$1About Juan
Data Science and Analysis
Medellin, Colombia - 10:21 am local time
Skilled in Python (Pandas, NumPy, scikit-learn), Excel, Power BI
Data workflows: cleaning, modeling, analysis, and visualization
Full support from data preparation to reporting
Clear and consistent communication is a priority for me, so let’s stay connected.
Steps for completing your project
After purchasing the project, send requirements so Juan can start the project.
Delivery time starts when Juan receives requirements from you.
Juan works on your project following the steps below.
Revisions may occur after the delivery date.
Requirement Gathering & Data Review
Collect and review client requirements, available datasets, and project objectives to ensure clear alignment.
Data Processing & Analysis
Clean, organize, and analyze the data using appropriate tools; create interactive dashboards and visualizations.