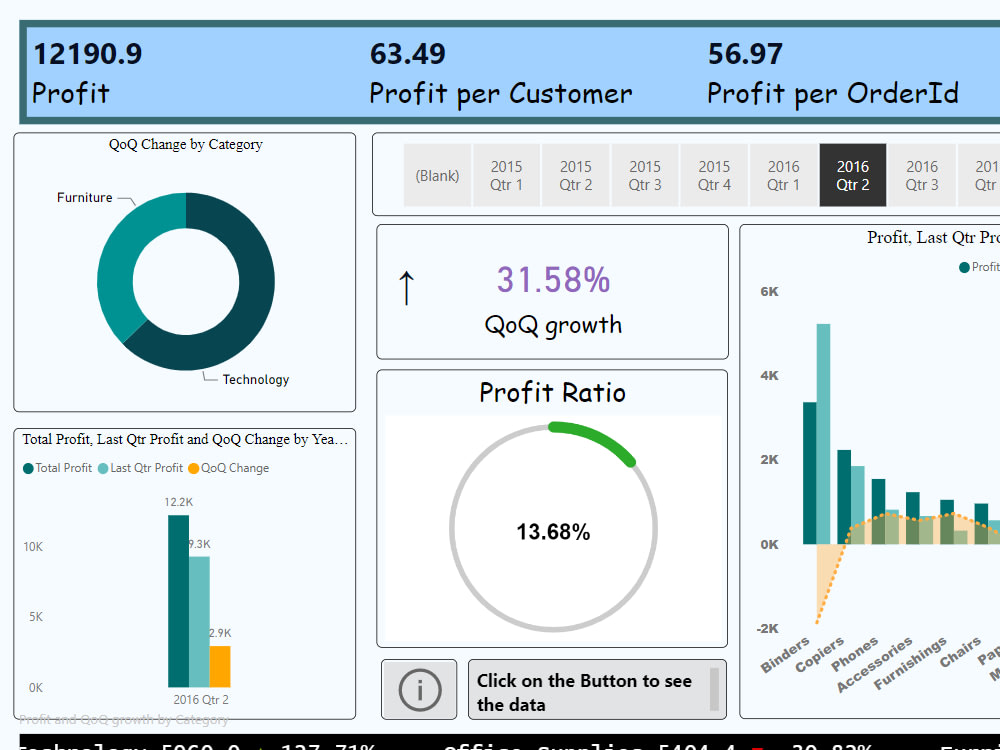
You will get executive power BI dashboard
Rising Talent
Project details
>>>WHY ME?
Akriti is the Director of Instrovate Technologies - A Microsoft Gold
Partner and is also a Microsoft Certified Trainer ( MCT ) herself
and is associated with multiple Microsoft Gold Partners , trained
thousands of participants across the globe.
I have a good knowledge of how to manage and present data and I will provide professional dashboard for your business performance and KPIs.
I'm the right person if you want to create a consistent and reliable Power BI dynamic dashboard for your business.
>>>WHAT CAN I DO?
Integrate POWER BI with any backend like SQLSERVER, ORACLE, SNOWFLAKE, DATABRICKS by using industry best standards
Define custom columns & meassure.
Build and Automate an Extract-Transform-Load process of any data into a Data Model
Create and organize a consistent Entity/Relationships Data Model for your visuals
Custom Report and Professional Dashboard
Beautiful visualizations such as Tables, Charts, Graphs, Maps, Networks
Dynamic filter
and much more!
Data Tool
Microsoft Power BIWhat's included
| Service Tiers |
Starter
$75
|
Standard
$125
|
Advanced
$200
|
|---|---|---|---|
| Delivery Time | 2 days | 3 days | 4 days |
Number of Revisions | 2 | 2 | 3 |
Number of Graphs/Charts | 6 | 12 | 18 |
Number of Variations | 2 | 2 | 2 |
Data Source Connectivity | |||
Web Embedding | |||
Interactive/Animated Visuals |
Optional add-ons
You can add these on the next page.
Additional Graph/Chart
(+ 2 Days)
+$10
Additional Variation
(+ 2 Days)
+$10
22 reviews
(22)
(0)
(0)
(0)
(0)
This project doesn't have any reviews.
AU
Armae U.
Apr 30, 2026
Microsoft Certified Trainer to deliver SC-200 class in GMT+8 timezone
Very patient instructor, always on top of things. Very cooperative and nice to work with.
CM
Cyrill Anne M.
Dec 19, 2025
Microsoft Certified Trainer to deliver PL-500 class in GMT+8 timezone
Good trainer and willing to communicate
AU
Armae U.
Nov 26, 2025
Microsoft Certified Trainer to deliver DP-601 class in GMT+8 timezone
The team is great to work with as always. Very professional.
CM
Cyrill Anne M.
Nov 26, 2025
Microsoft Certified Trainer to deliver MS-4014 class in GMT+8 timezone
AU
Armae U.
Nov 14, 2025
Microsoft Certified Trainer to deliver MS-4018 class in GMT+8 timezone
Akriti is very cooperative and really handles the class well.
About Akriti
Microsoft Certified Power Apps, Power BI Trainer & Consultant PL#100
Gurgaon, India - 5:06 pm local time
She is a Data Analytics and Data Visualization Consultant/Corporate Trainer with a Decade of experience in different industry verticals.
Empowering organizations to harness the full potential of their data! As a
Data & Analytics Consultant, I specialize in driving business intelligence,
data engineering, and low-code application development through leading
technologies:
Snowflake Cloud: Crafting scalable data architectures and data warehousing
solutions for informed decision-making.
Databricks: Designing ETL pipelines, data engineering, and transformation for
robust data integration.
She has worked extensively on data visualization tools like Tableau , Microsoft Power BI , Microsoft Power BI Services , Looker , Qlik Sense
She has had a chance to mentor and work with professionals of Fortune 100 to Fortune 500 companies, handling business in Finance, health, Media and entertainment, Software-As-A-Service (SAAS) companies for hospitality etc.
She has a wide range of training experience from training Experienced Professionals & members of Leadership Team ( LT ) to Students from different Engineering Colleges and Educational Institutes.
She is a passionate Blogger and likes to write on a wide variety of topics during her free time.
Last Few Data Visualization / Tableau Corporate Training's with avg feedback of 4.5/5 at
۞ Advance Data Viz Training at American Express - August - July 2018
۞ Data Viz Training To Group of 55 participants at Great Lakes , Bangalore Batch- August - July 2018
۞ 4 day Advance Data Viz Training at CVENT- June 2018
۞ Advance Data Viz Training with multiple data sources like sql server , Hadoop Hive at Sun Life Financials June 2018
۞ IBM , Bangalore Dat Viz Training # May 2018
۞ Great Lakes Hyderabad Data Viz Training with feedback of 4.83 / 5 # May 2018
۞ Tableau Connectivity with Hortonworks and Cloudera Hadoop / Hive/ Impala at Great Lakes
Hyderabad # April 2018
۞ Ernst & Young # March 2018
۞ American Express #March 2018 ,
۞ EXL Service #February 2018 ,۞ CVENT : Dec 2017 ۞ Optum Global Solutions ۞ EXL Services ۞ AON Alight ۞ Fidelity International ۞ AON , Noida ۞ Sun Life Financial ۞ Bain & Company ۞ ApprissHealth ۞ Incedo Inc ۞ Bennett Coleman & Company Limited ( BCCL ) ۞ Jones Lang Lasalle (JLL ) ۞ Times Internet ۞ Value Edge ۞ IMS Eng College [ IMSEC ]۞ RIET Jaipur
۞ Ability to find out valuable knowledge and actionable insights from raw data using Tableau
Designed and developed many Tableau visualization For Different Industry Verticals, POC reports,Pre-Sales, Sales report etc.
Ability to Quickly Understand business Processes & Requirements in order to effectively develop
Technical solutions and Tableau Visualization.
Strong knowledge of Tableau Visualization,Dashboard,Story And Development Best Practices.
Tableau Desktop / Server / Online Experience to develop Interactive & Dynamic dashboards.
Excellent Client Interaction Skills and Quick Understanding of Converting Data into Visualization.
Experience working on business intelligence & analytical reporting platforms
Experience gathering, and translating end user requirements into effective & efficient dashboards.
Experience connecting Tableau to various data sources -MS Excel, CSV, Text ,Oracle,MS Access, SQL Server, Hadoop, Hortonworks Hive, Google Big Query , Aster,, etc. (live connection or extracts)
Experience creating joins, joins with custom SQL & blending data from different data sources using Tableau Desktop
Knowledge of working with various Tableau Desktop functionalities & capabilities (Filters, Hierarchies, Sorting, Sets, Parameters, Custom Groups, Creating Story, Mapping, Custom Geocoding, etc.)
Exposure to Tableau Server and Publishing Workbook to Tableau Server and Administration.
Exposure in setting up the distribution & publication process using Tableau Server for scheduled production dashboards & reports
Ability to turn large amounts of raw data into actionable information;
Excellent communication skills .
Steps for completing your project
After purchasing the project, send requirements so Akriti can start the project.
Delivery time starts when Akriti receives requirements from you.
Akriti works on your project following the steps below.
Revisions may occur after the delivery date.
Share the work with client
Will share the report with client for review