You will get a Python Prediction Customer Churn Analysis
Project details
I deliver a complete, end-to-end Customer Churn Analysis and Prediction solution using Python and machine learning. This project goes beyond basic analysis by combining exploratory data analysis, feature engineering, robust preprocessing pipelines, and multiple predictive models to accurately identify customers at risk of churning.
Using your customer data, I analyze behavioral, demographic, and financial patterns that drive churn, visualize key insights, and build a production-ready machine learning pipeline. Multiple models are trained and compared using cross-validation, with the best-performing model selected based on ROC-AUC and other key metrics. The final solution includes model evaluation, feature importance analysis for interpretability, and example predictions for new customers.
You will receive clean, well-documented code, visual insights, and a reusable churn prediction pipeline that supports data-driven retention strategies and business decision-making.
Project Type
Data Entry, Ecommerce Management, Project Management, Virtual Assistance, Customer Support, OtherWhat's included
| Service Tiers |
Starter
$50
|
Standard
$120
|
Advanced
$250
|
|---|---|---|---|
| Delivery Time | 3 days | 5 days | 7 days |
Number of Revisions | 1 | 2 | Unlimited |
Frequently asked questions
1 review
(1)
(0)
(0)
(0)
(0)
This project doesn't have any reviews.
OI
Omweri I.
Feb 22, 2026
Excel Data Cleaning & Formatting
He is competent.
About Kevin
Data Analyst | Power BI & Dashboard Expert | SQL | Python | Automation
Nairobi, Kenya - 2:16 am local time
Whether you need to automate a manual Excel report or build a complex data model from scratch, I bridge the gap between technical data and business strategy.
Here is how I can help you
✔ Interactive Dashboards
- Designing Power BI & Excel reports that visualize your KPIs clearly (Sales, Finance, Operations, Marketing, Healthcare, Telecom).
✔ Data Cleaning & Automation
- Using Python and Power Query to clean messy datasets and automate repetitive reporting tasks, saving you hours every week.
✔ Database Management
- Writing optimized SQL queries to extract, validate, and organize your data efficiently.
📈 Advanced Analytics
- Utilizing DAX and statistical methods to uncover hidden trends, patterns, and correlations in your data.
My Technical Stack:
📌Visualization: Power BI, Tableau, Advanced Excel (Pivot Tables, Charts).
📌Processing: SQL, Python (Pandas, NumPy), Power Query.
📌Formulas: Advanced DAX, Excel Complex Formulas (XLOOKUP, VBA).
Why work with me?
✔Beyond just coding, I focus on the "So What?" of your data. I don't just hand over a chart; I ensure you understand the story it tells so you can take action immediately.
✔I am responsive, detail-oriented, and available for voice calls to discuss your specific requirements.
Ready to turn your data into an asset?
Click the green "Invite" button at the top right, and let's discuss your project.
Kevin
Steps for completing your project
After purchasing the project, send requirements so Kevin can start the project.
Delivery time starts when Kevin receives requirements from you.
Kevin works on your project following the steps below.
Revisions may occur after the delivery date.
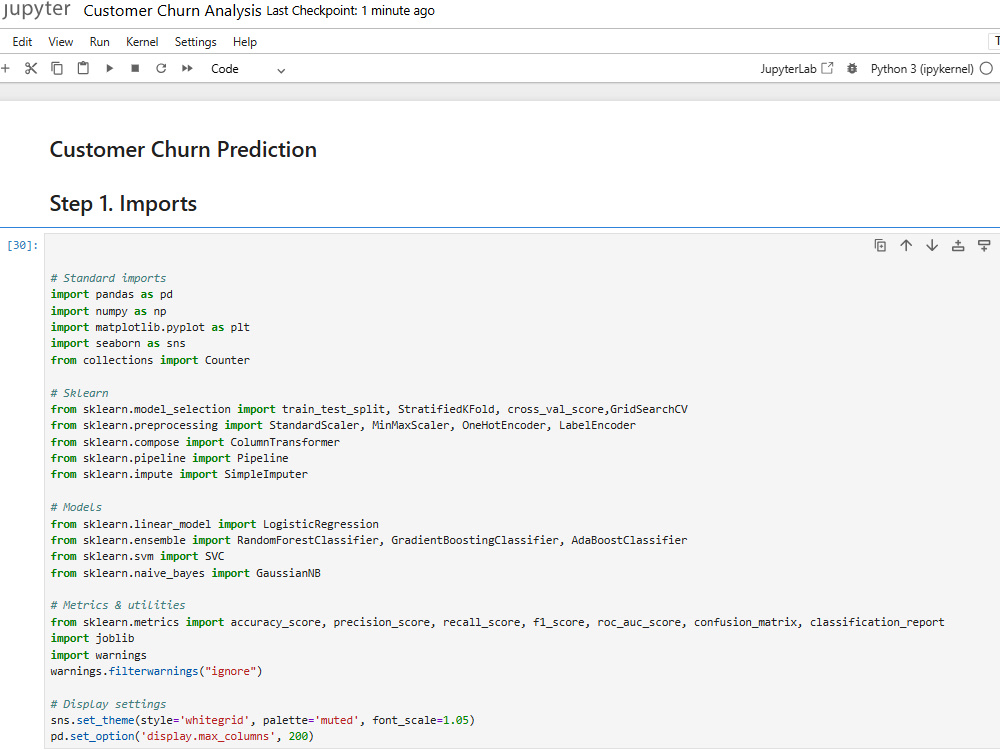
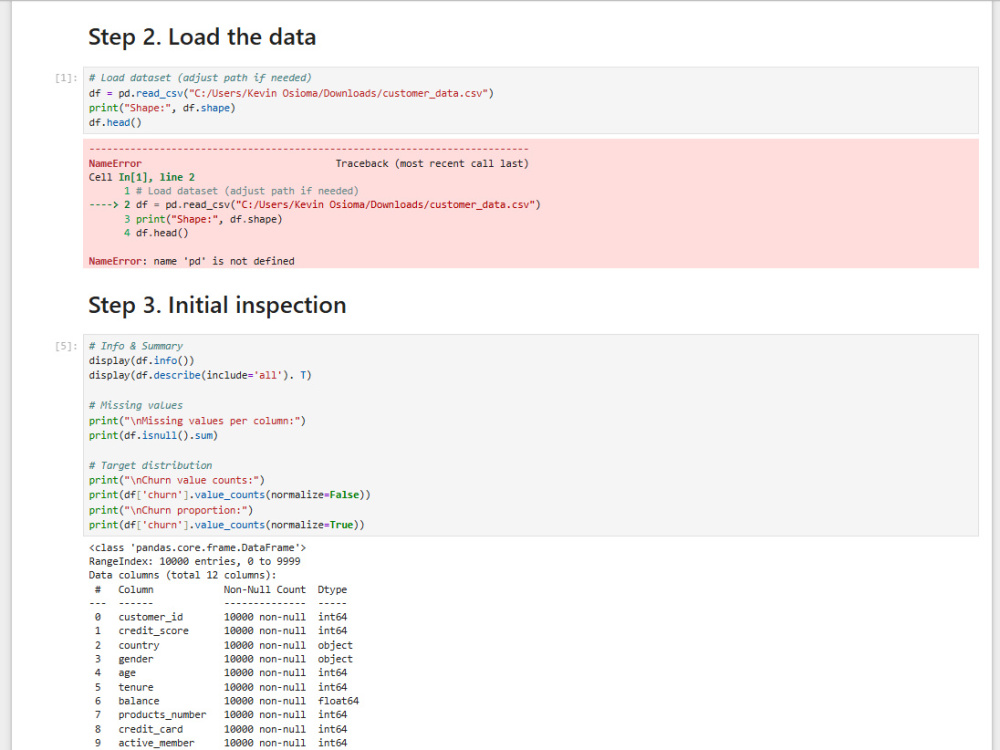
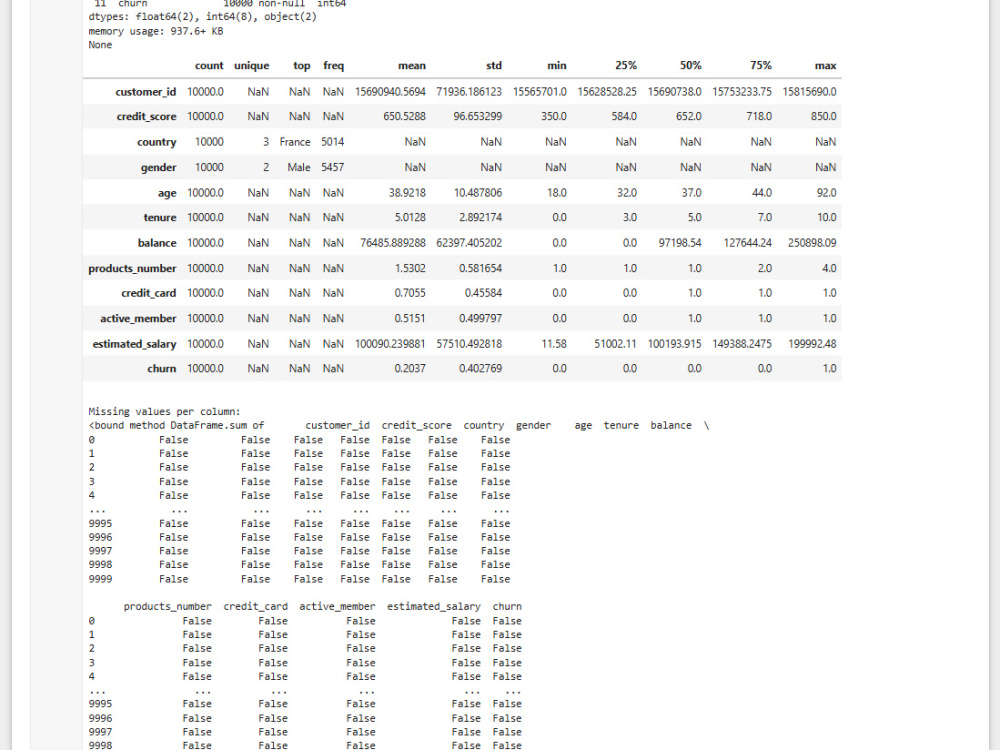
Data loading and validation
Libraries import the dataset, load it, verify the schema and data types, check for missing values, and confirm the churn distribution to ensure data quality.
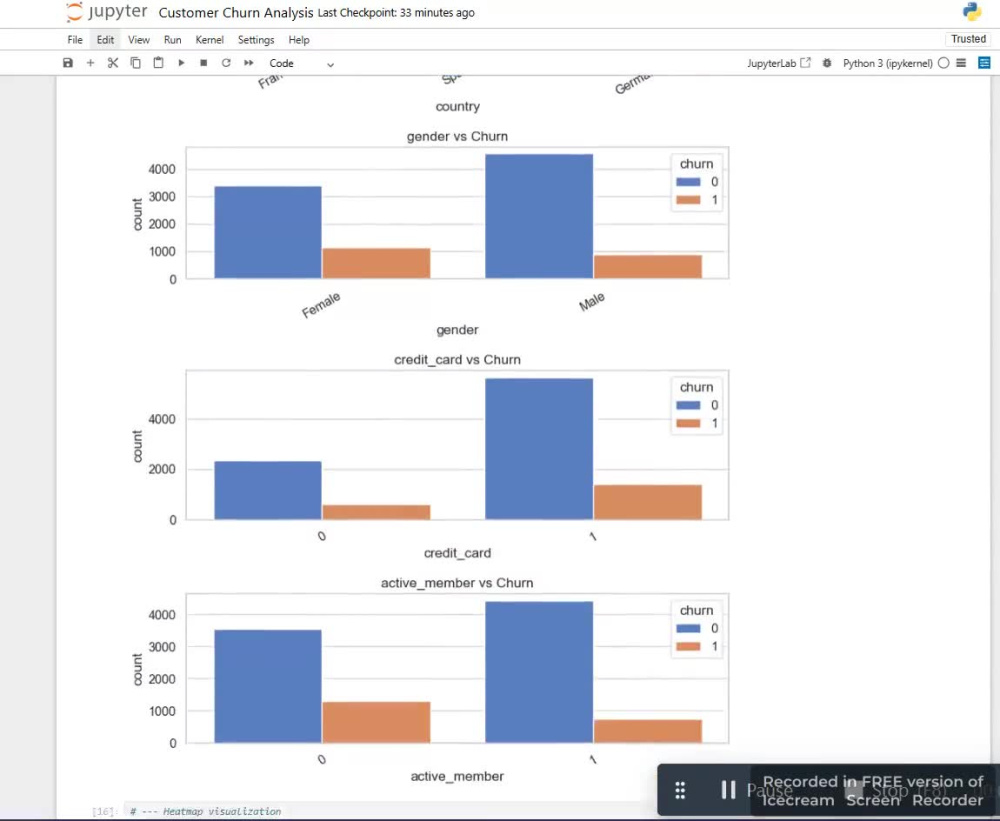
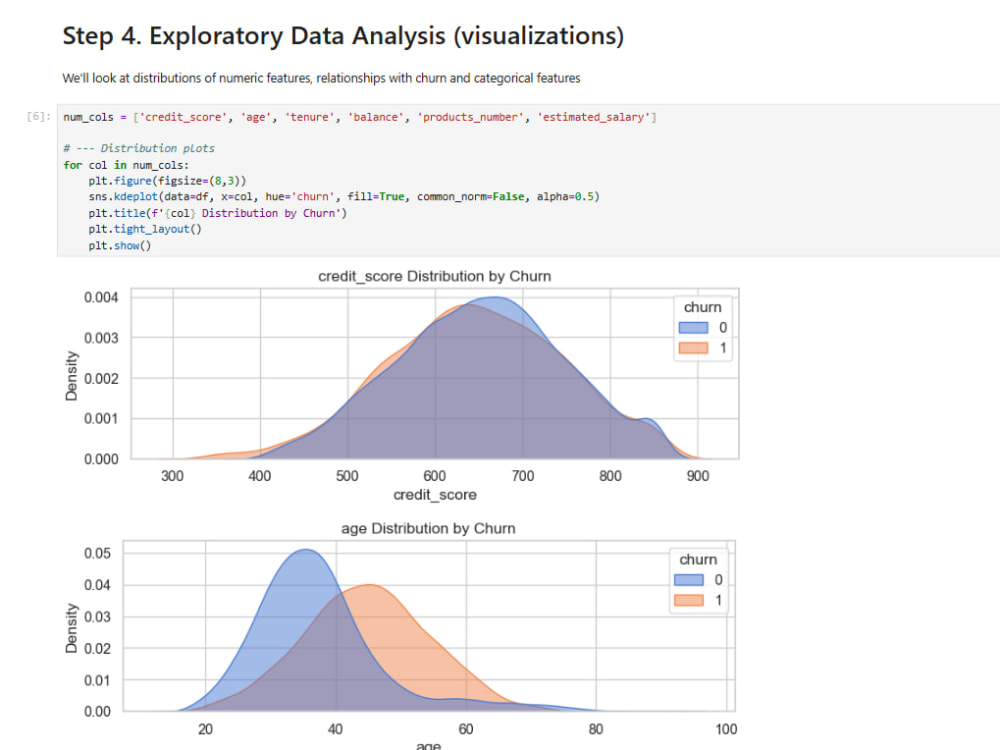
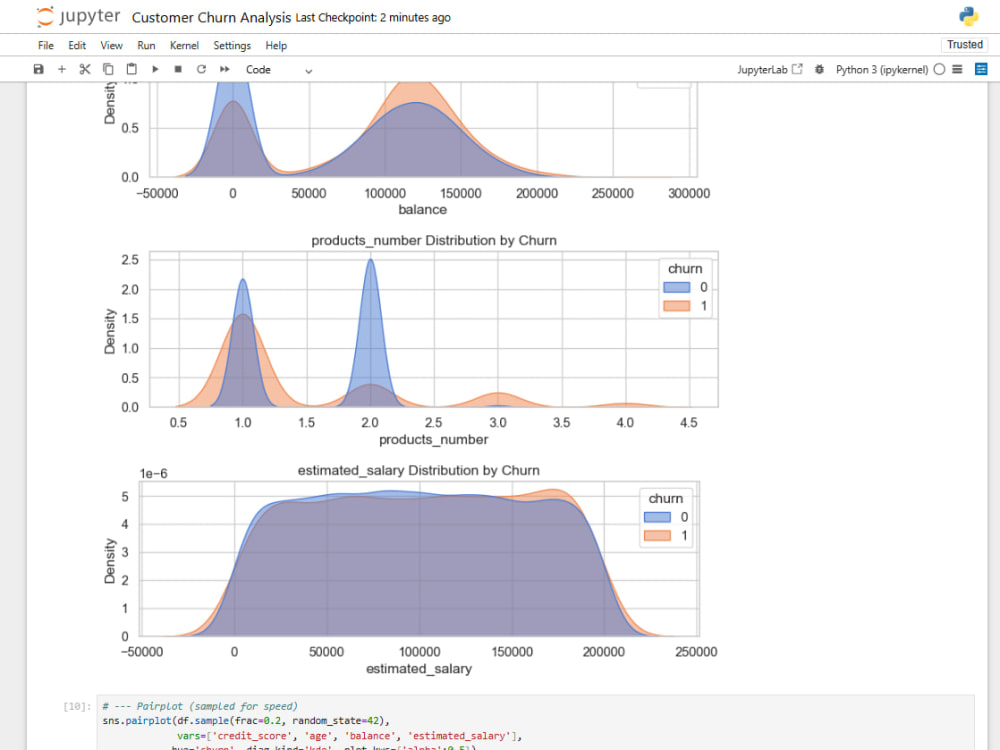
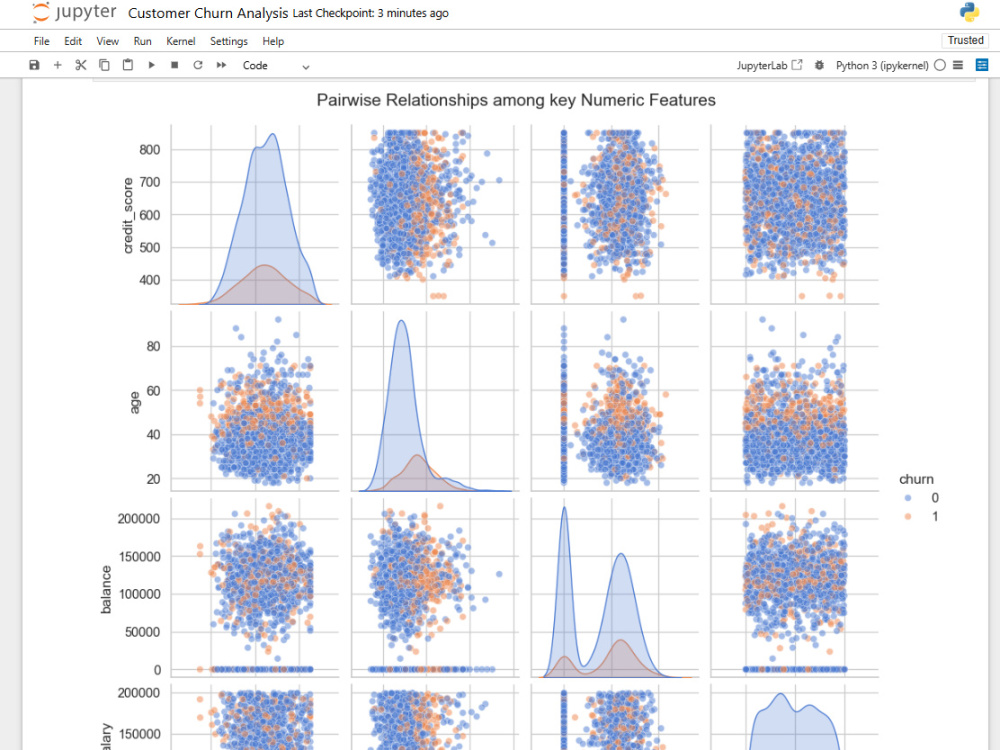
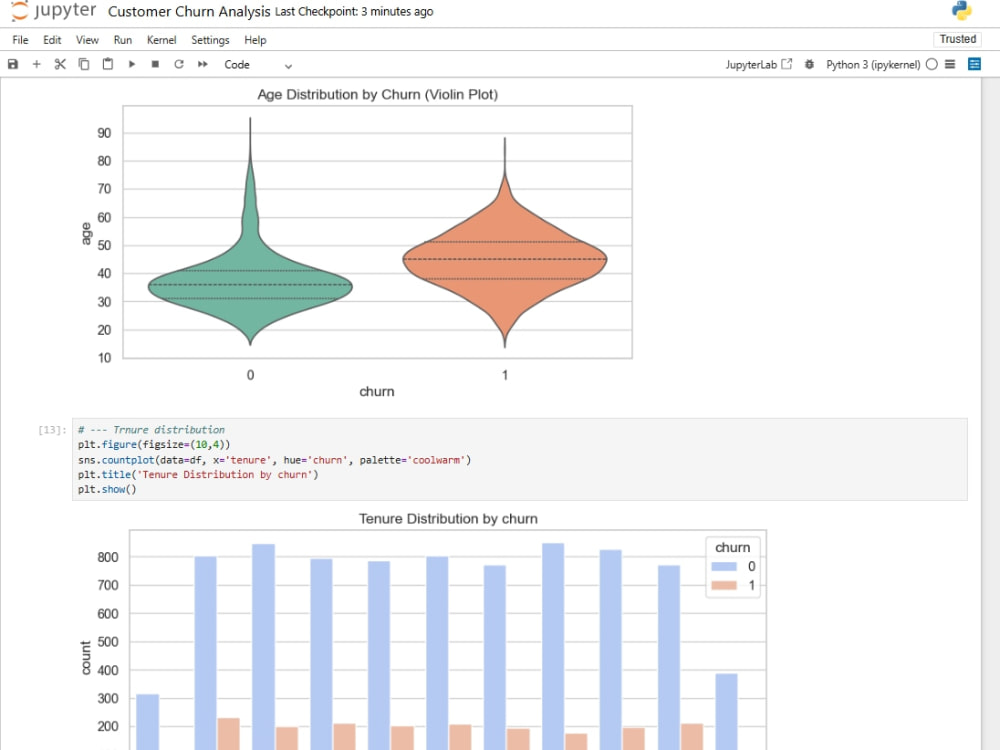
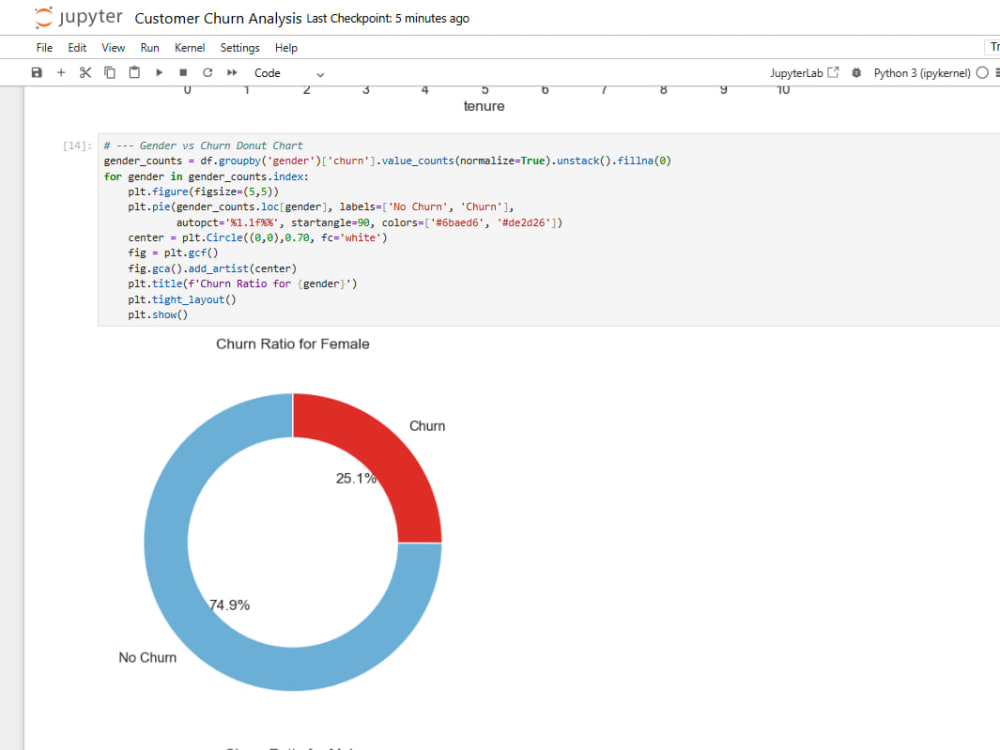
Exploratory Data Analysis (EDA)
Analyze numeric and categorical features using visualizations to identify patterns, trends, and churn drivers.