You will get Data Analysis By Excel Pivot Table
Project details
Project Objective:-
To reduce store expenditures
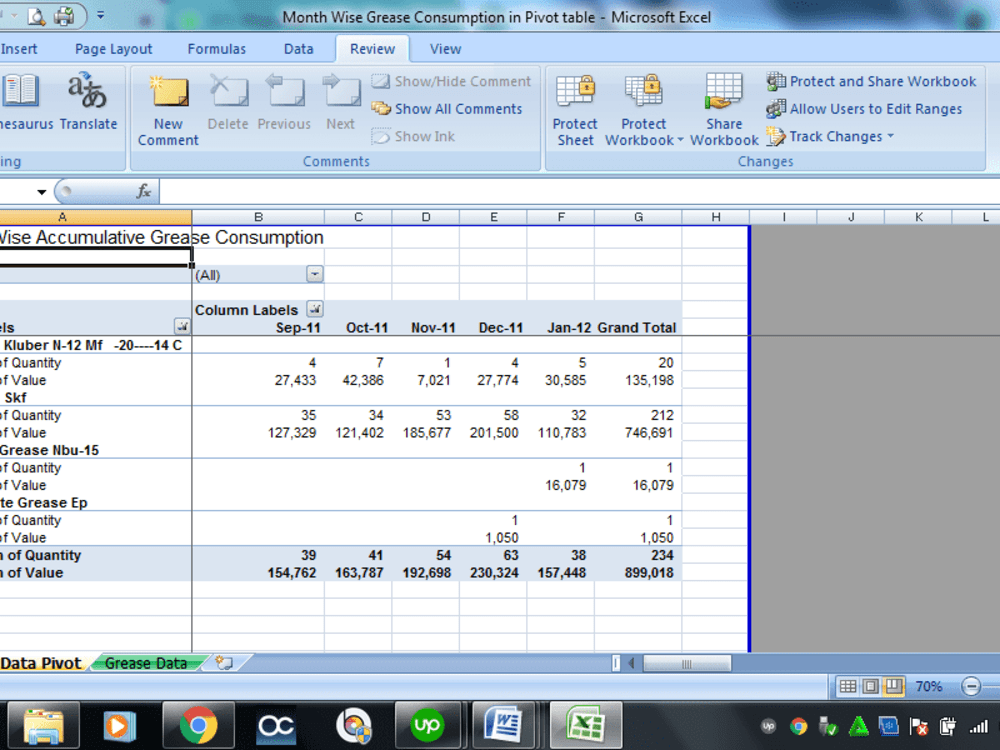
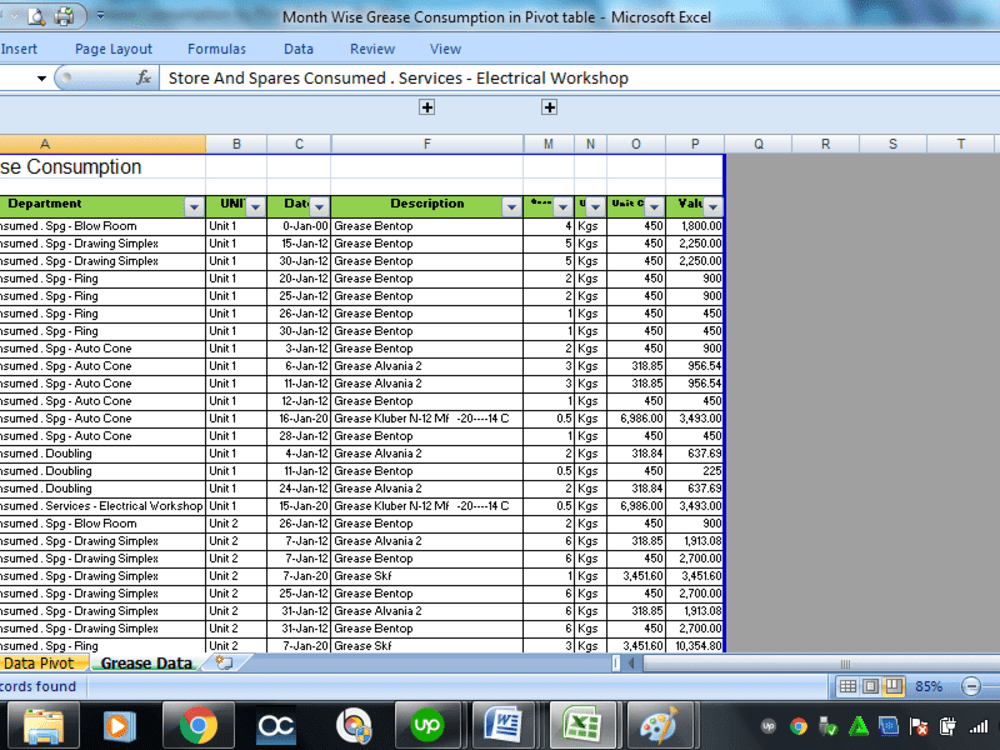
1. In this project I have worked on a textile mills group store inventory “this textile group has 12 textile units at a different location at Pakistan” I have prepared a datasheet in excel “Combine data of store issue requisition” approximately one-year data and prepare professional reports by using Excel Pivot Table. Some examples are given below and picks are attached to my project.
a. working on oil & lubricants Ref. report is attached
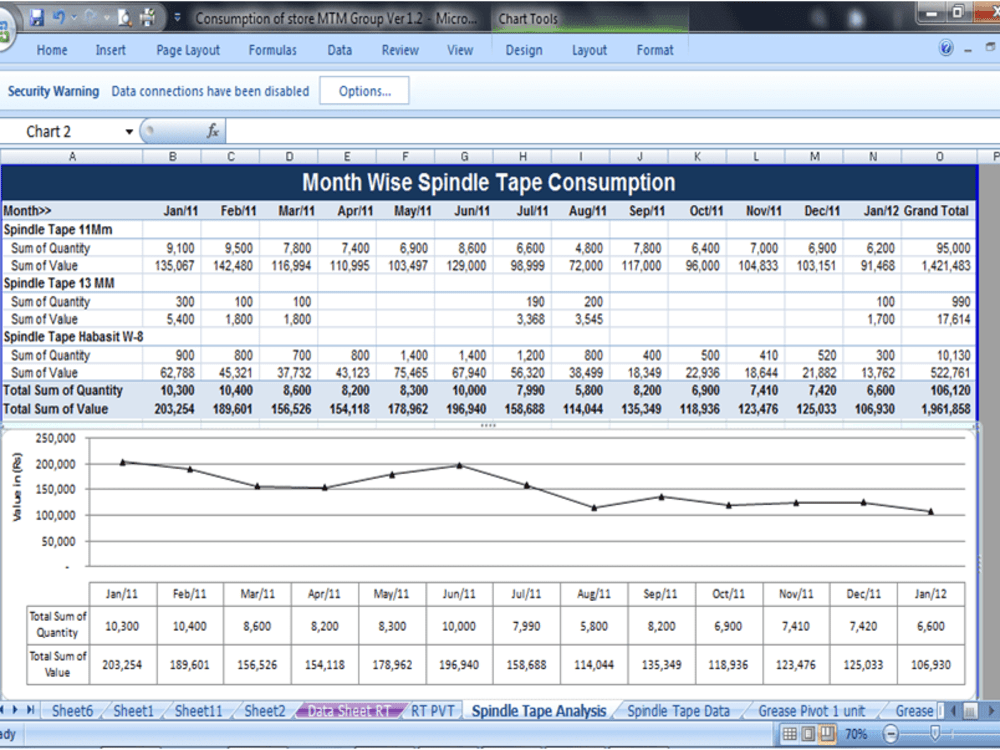
b. working on Spindle Tape Ref. report is attached
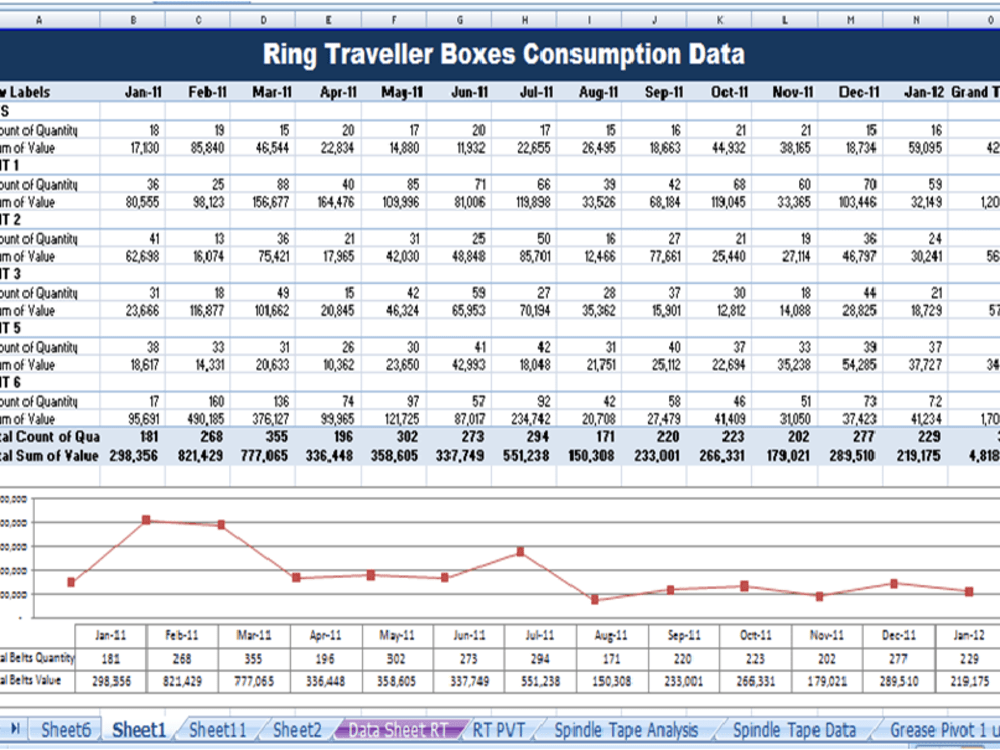
c. working on Ring Travelers Ref. report is attached
2. Worked on slow-moving and dead stock items by extracting data into an excel sheet and formatting it by stock lever month-wise/year-wise purchases. In the context of these reports, management gets direction to revise purchasing procedures and set minimum inventory levels. And transferred the said dead stock where it is required and stock excess purchasing of the relevant goods.
Benefit:- Company saved 1 billion by working on the above procedure.
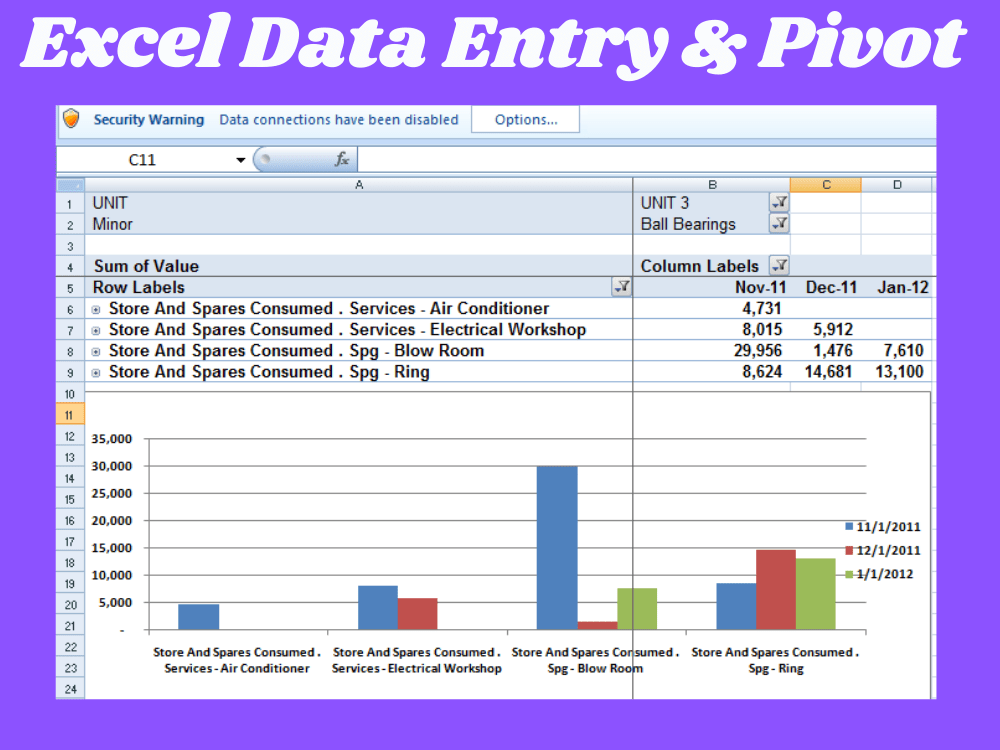
You will get professional reports with graphically “charts” to make a decision or to achieve the business objectives.
To reduce store expenditures
1. In this project I have worked on a textile mills group store inventory “this textile group has 12 textile units at a different location at Pakistan” I have prepared a datasheet in excel “Combine data of store issue requisition” approximately one-year data and prepare professional reports by using Excel Pivot Table. Some examples are given below and picks are attached to my project.
a. working on oil & lubricants Ref. report is attached
b. working on Spindle Tape Ref. report is attached
c. working on Ring Travelers Ref. report is attached
2. Worked on slow-moving and dead stock items by extracting data into an excel sheet and formatting it by stock lever month-wise/year-wise purchases. In the context of these reports, management gets direction to revise purchasing procedures and set minimum inventory levels. And transferred the said dead stock where it is required and stock excess purchasing of the relevant goods.
Benefit:- Company saved 1 billion by working on the above procedure.
You will get professional reports with graphically “charts” to make a decision or to achieve the business objectives.
What's included
| Service Tiers |
Starter
$25
|
Standard
$50
|
Advanced
$100
|
|---|---|---|---|
| Delivery Time | 4 days | 3 days | 2 days |
Number of Revisions | 2 | 3 | 4 |
Number of Hours of Work | 3 | 4 | 5 |
Formatting & Clean Up | |||
Graph & Table Creation |
Optional add-ons
You can add these on the next page.
Fast Delivery
+$10 - $30About Ghulam
VA | Data Entry | Pivot Tables | Chart & Graph | Content Writer
Multan, Pakistan - 4:30 pm local time
As a data entry specialist I am responsible for accurately inputting and updating large amounts of data by client desire database. This may include inputting customer information, financial data, inventory records, internet research data or social medial collection data like "LinkedIn, Twitter, Facebook etc., or any other data relevant to the company's operations OR conducting research, developing ideas, and writing articles, blog posts, product descriptions etc.,
My fast typing skills and non stope internet are essential for this role. I am available for online & offline data entry and prepare professional reports like to keep in view all professional formatting like all kind of content headings, fonts and working on ranking research keywords.
Why you hire me?
-Honest
-Reliable
-Confident
-Responsible
-Quick learner
-Work with minimum directions
-Follow the deadlines (Timely delivery)
-Always complete the commitments
-Available maximum time
Steps for completing your project
After purchasing the project, send requirements so Ghulam can start the project.
Delivery time starts when Ghulam receives requirements from you.
Ghulam works on your project following the steps below.
Revisions may occur after the delivery date.
Data sheet formating
I will format the datasheet Ist of all than aline data column and row as desired the client.
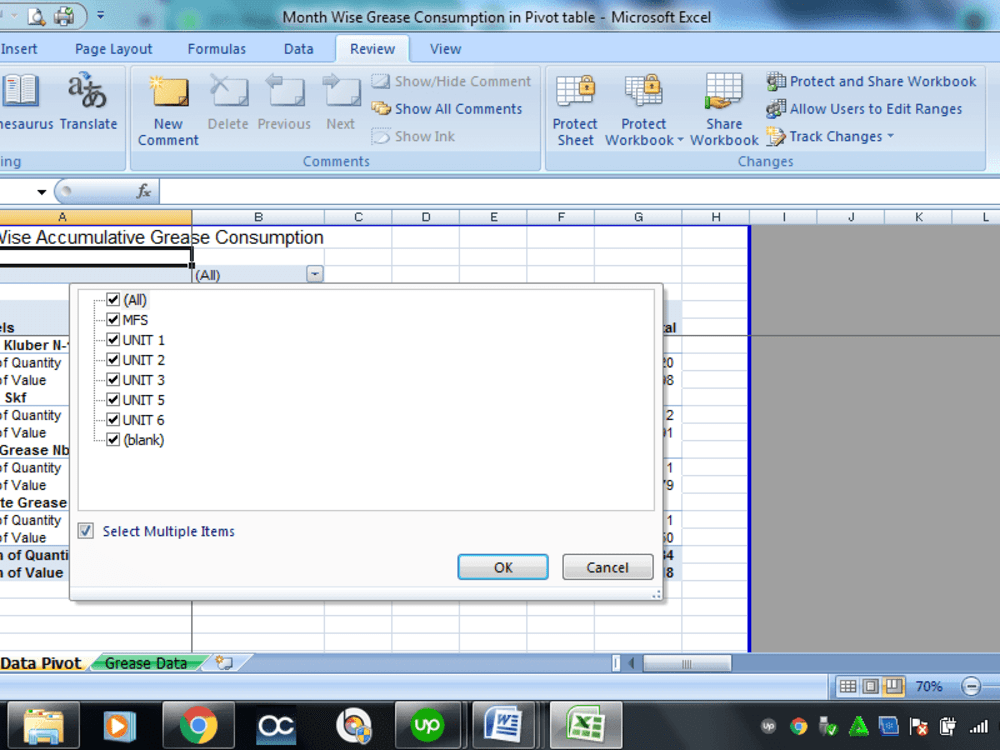
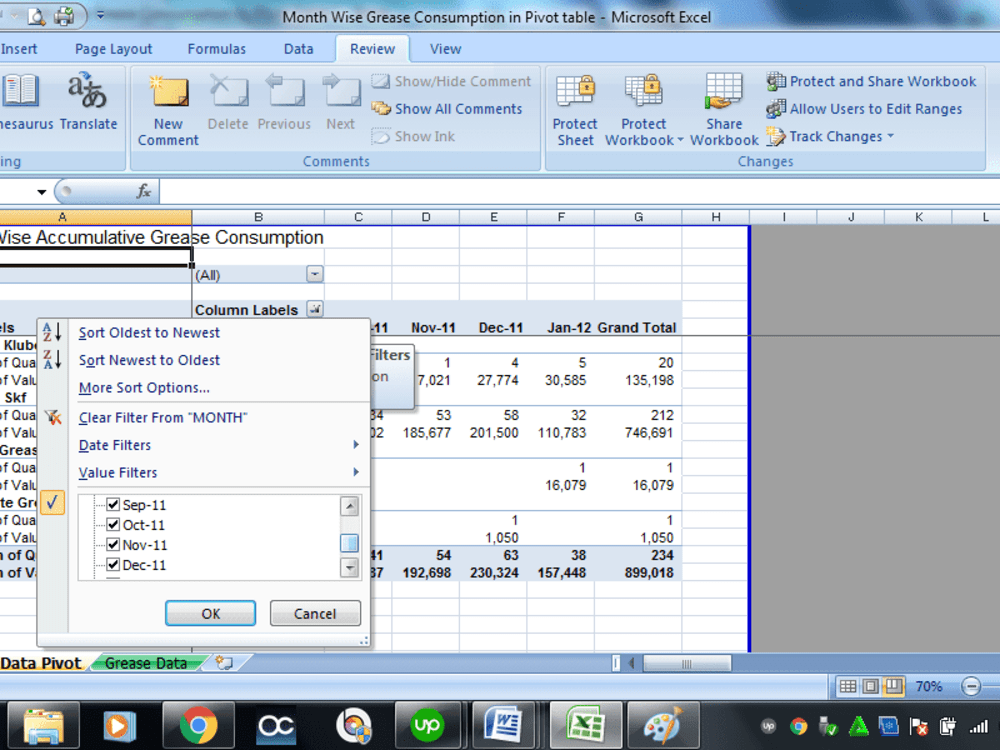
Pivot
Prepare pivot table keeping in view the requirements of the client.