You will get E-Commerce Profit Dashboard for Shopify & WooCommerce Sellers
Project details
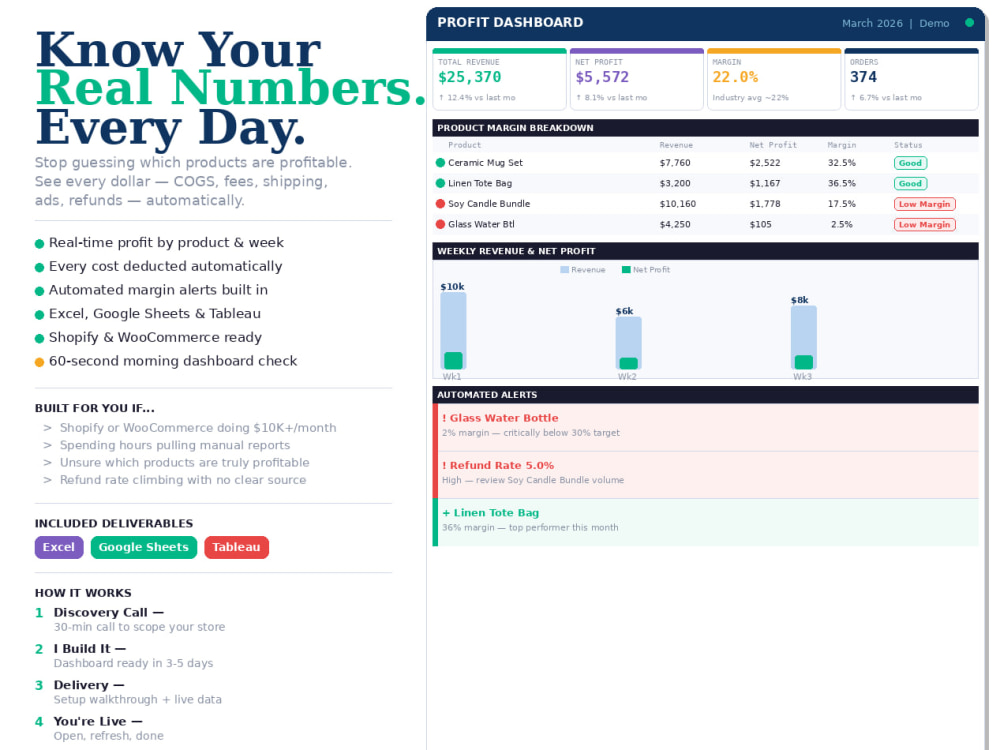
📊 **Dashboard**
Your at-a-glance command center. Shows Total Revenue, True Net Profit, Blended Margin %, Total Orders, and Refund Rate as live KPI cards. Includes a Product Margin Breakdown table and Automated Alerts that update based on your actual numbers — no editing required.
📦 **Product Summary**
Revenue, COGS, shipping, ad spend, refunds, net profit, and margin % broken out by product. Color-coded status column (Excellent / Good / Watch / Low Margin) updates automatically based on each product's real margin.
📅 **Weekly Summary**
See your revenue, costs, and profit broken into four weekly bands for the selected month. Week labels, date ranges, and all figures update dynamically when you switch months.
📥 **Raw Data**
The only sheet you ever touch. Paste your export here — one row per product per date entry. Works with data from Shopify exports, WooCommerce reports, or any CSV with date, product, and cost columns.
→ Handles multi-month data in a single file — no separate workbook per month
→ Auto-expanding data table — add rows and formulas update automatically
→ Conditional color coding on margin % and status fields — red, amber, green
Industry
Consumer Goods, EcommercePlatform
Etsy, Shopify, WooCommerceLanguage
EnglishWhat's included
| Service Tiers |
Starter
$497
|
Standard
$997
|
Advanced
$1,597
|
|---|---|---|---|
| Delivery Time | 3 days | 5 days | 7 days |
Management Duration (Days) | 0 | 30 | 90 |
Inventory Management | - | - | - |
Order Management | - | - | - |
Customer Assistance | - | - | - |
Payment Processing | - | - | - |
Product Offers & Promotions | - | - | - |
Reporting |
Optional add-ons
You can add these on the next page.
Monthly Maintenance Retainer
+$200
Additional Platforms
(+ 3 Days)
+$200Frequently asked questions
About Ginny
SQL Report Developer | Financial Dashboards & Database Support
Lutz, United States - 11:21 am local time
Specialties include:
Financial reporting, SQL support, dashboard development, Excel analysis, KPI reporting, data cleanup, trend analysis, margin visibility, monthly reporting packages, and business performance reporting.
Certified Intuit Bookkeeper
Steps for completing your project
After purchasing the project, send requirements so Ginny can start the project.
Delivery time starts when Ginny receives requirements from you.
Ginny works on your project following the steps below.
Revisions may occur after the delivery date.
After 30 minute discovery call depending on product purchased
✓ Custom Dashboards ✓ Setup walkthrough so you can connect live data yourself