You will get Excel Data Entry Cleaning and Dashboard Support
Project details
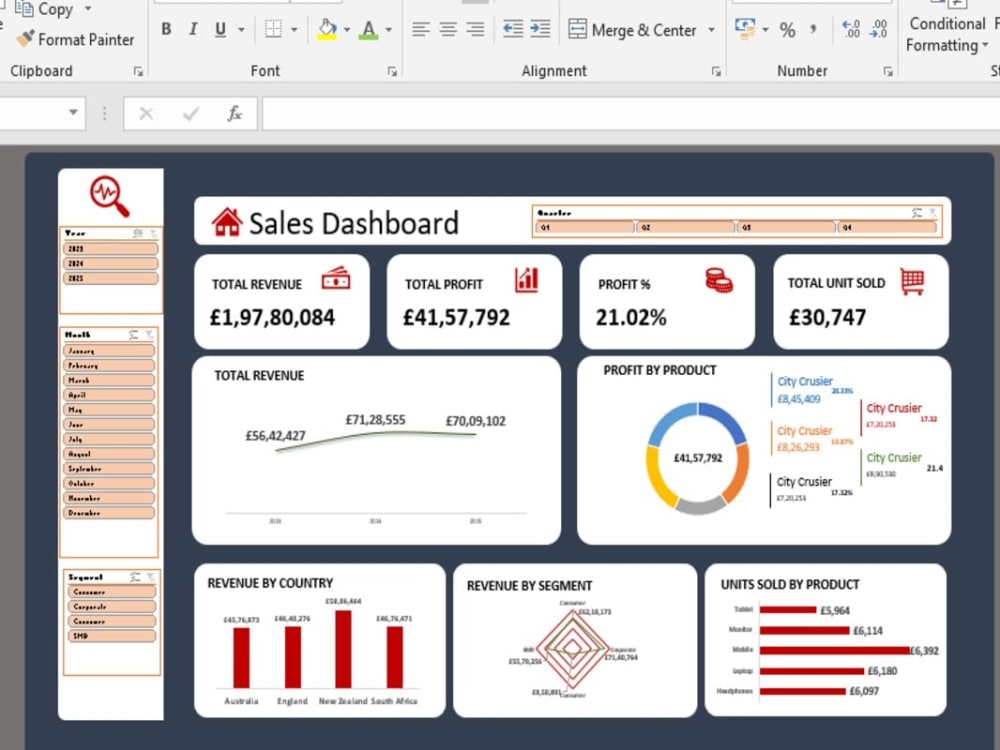
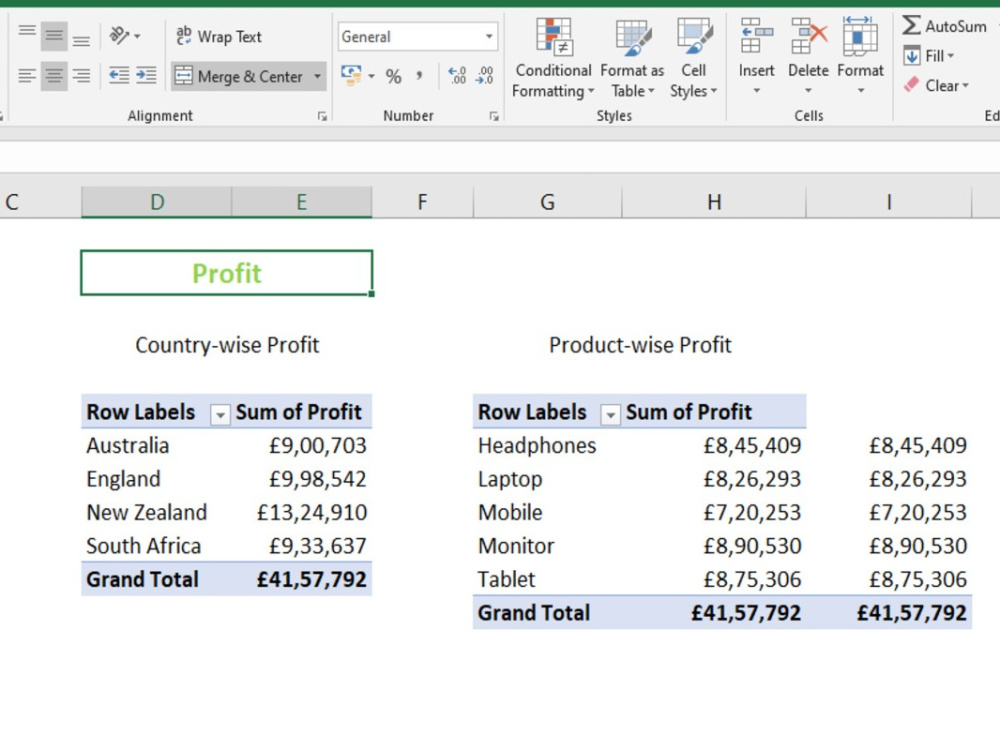
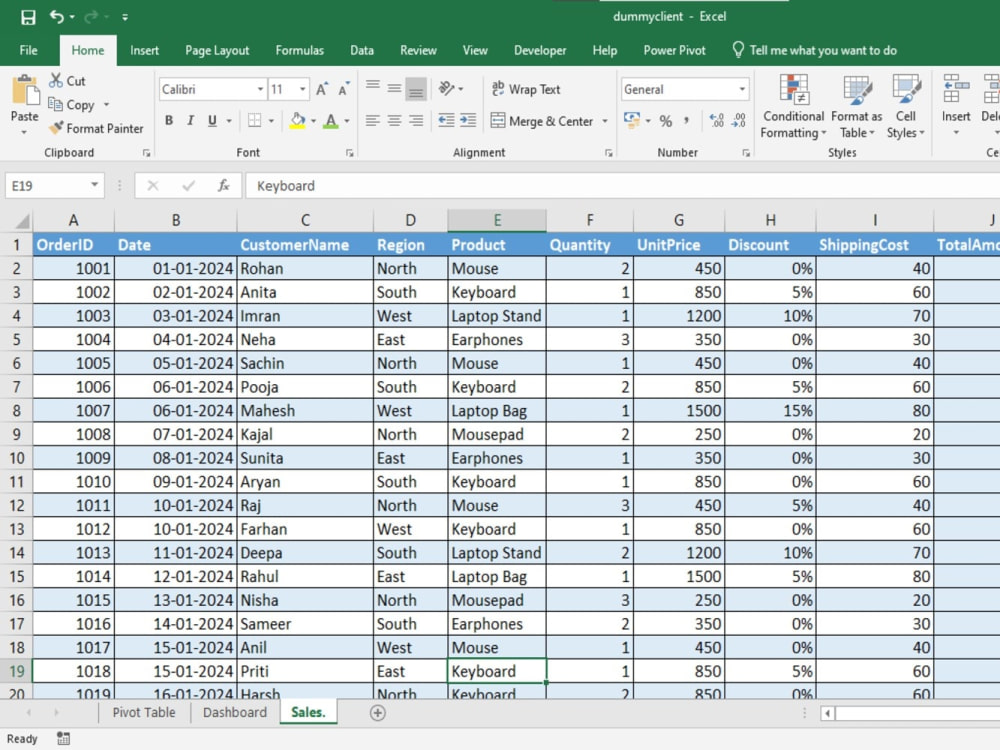
I provide advanced Excel data analysis to help businesses make better decisions. This includes data cleaning, formatting, pivot tables, charts, dashboards, and summary reports. I ensure accuracy, clear structure, and easy-to-understand insights . You will receive a well-organized Excel file with meaningful analysis that saves time and improves reporting quality.
Data Entry Type
Copy Paste, Data Cleansing, Document Conversion, Online Research, Word ProcessingData Entry Tool
Google Docs, Google Sheets, Microsoft Office, Microsoft WordWhat's included
| Service Tiers |
Starter
$18
|
Standard
$43
|
Advanced
$84
|
|---|---|---|---|
| Delivery Time | 2 days | 3 days | 5 days |
Number of Revisions | 1 | 2 | 3 |
Number of Hours of Work | 2 | 4 | 8 |
Formatting & Clean Up | |||
Graph & Table Creation | - |
Optional add-ons
You can add these on the next page.
Additional Revision
+$8
Graph & Table Creation
(+ 1 Day)
+$10Frequently asked questions
About Amaan
Excel Data Analyst | Dashboards, Pivot Tables & Data Cleaning
Burhanpur, India - 2:47 pm local time
I help businesses analyze and organize Excel data into clear reports and dashboards that support better decision-making across sales, operation, and financial data.
My work includes data cleaning, pivot tables, Excel formulas, KPI dashboards, revenue and profit analysis, and structured reporting,
I focus on building clean, well-organized spreadsheets that are easy to understand and use.
I work with accuracy, clear communication, and on-time delivery.
Steps for completing your project
After purchasing the project, send requirements so Amaan can start the project.
Delivery time starts when Amaan receives requirements from you.
Amaan works on your project following the steps below.
Revisions may occur after the delivery date.
Step 1
Client shares requirements & data Client will provide Excel/CSV file and explain what analysis, cleaning, or dashboard is needed.
Step 2
Data processing & analysis I clean, format, analyze the data and create required tables, pivot, charts, or dashboards.