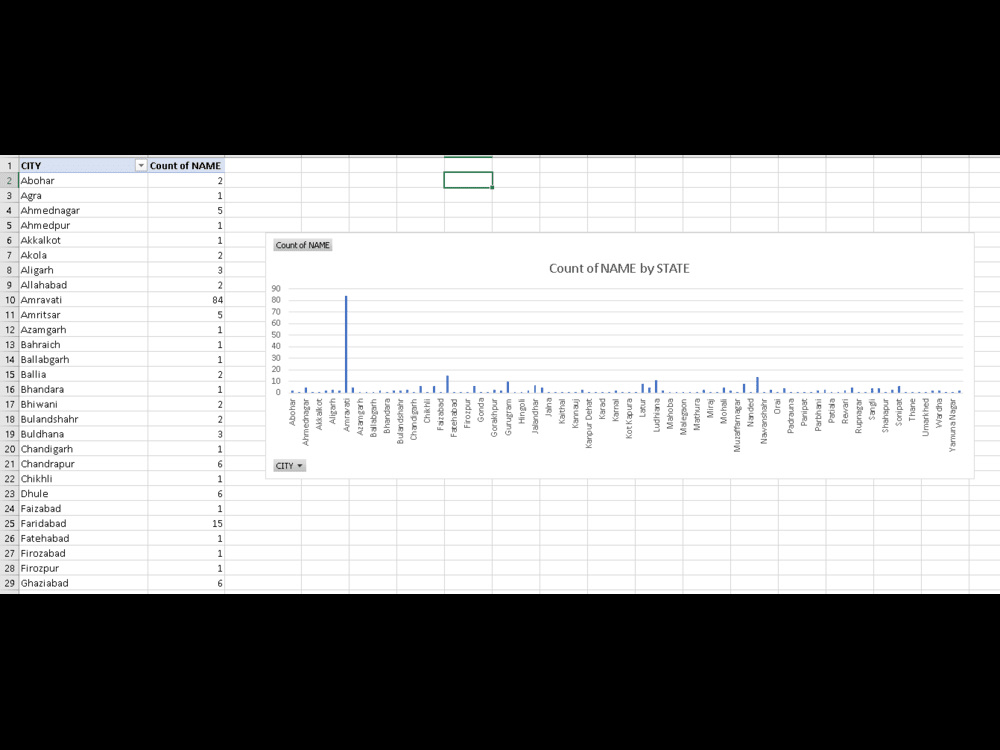
You will get Graphical Data representation of the information as per records.
Project details
The project basically a example for Microsoft excel tools example where a enlarge data is simply converted into the graphical data representation for the easy understanding and effective learning skill.
Data Entry Type
Copy Paste, Document Conversion, Online ResearchData Entry Tool
Google Docs, Google Sheets, Microsoft Excel, Microsoft Office, Microsoft WordWhat's included $10
These options are included with the project scope.
$10
- Delivery Time 2 days
- Number of Revisions 1
- Number of Hours of Work 4
- Formatting & Clean Up
- Graph & Table Creation
Optional add-ons
You can add these on the next page.
Fast 1 Day Delivery
+$2
Additional Revision
+$2
Additional Hour of Work
+$2About Munish
Microsoft Word, Microsoft Excel, Google Sheets, Bootstrap
Pathankot, India - 7:11 pm local time
Dedicated Graduate student with People and problem-solving skills ready for a fresh
and new challenge with an exciting organization which has ambitious plans for the
future
Steps for completing your project
After purchasing the project, send requirements so Munish can start the project.
Delivery time starts when Munish receives requirements from you.
Munish works on your project following the steps below.
Revisions may occur after the delivery date.
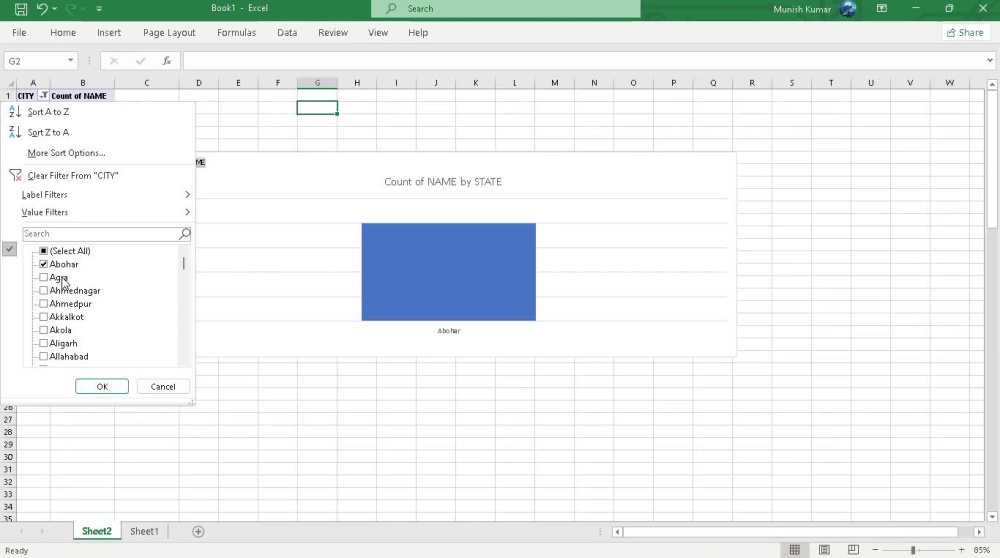
Use of graphs
1. Select the all data present in the excel sheet. 2. Then there is tool available in insert toolbar where different graphs and pie chart are available. 3. Choose the appropriate graph which is suitable for the data representation in best manner.