You will get Design a Professional Half-Yearly Sales & Credit Dashboard in Excel
Project details
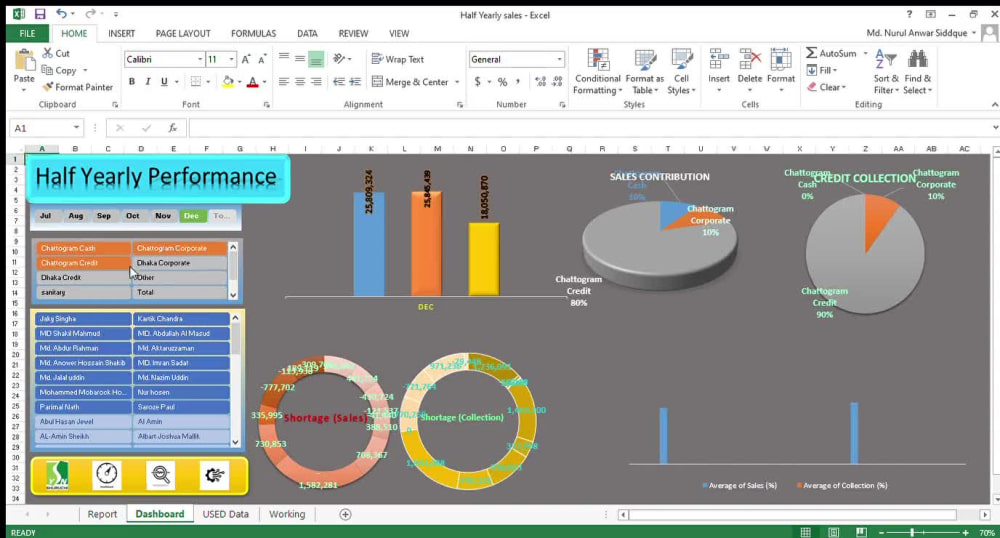
I will deliver a comprehensive Half-Yearly Sales and Credit Collection Report tailored to your business needs. This service includes not only accurate data entry but also in-depth analysis of your sales performance and credit collections. The final report will feature interactive charts, bar graphs, pie visuals, and aging analysis to help you make data-driven decisions.
Whether you require a straightforward breakdown or a deep-dive financial analysis, this report will empower you to monitor receivables, track default risks, and optimize your cash flow strategy.
#Scope of Work
Entry and processing of up to 1,000 rows of data
Comparative analysis: Sales vs. Credit Collection
Aging report to identify overdue invoices
Dynamic charts & visuals for at-a-glance insights
Tailored KPIs relevant to your industry
Exportable Excel file + optional Google Sheets version
#Deliverables
A clean, professional Excel file with charts
Summary of key findings and recommendations
Customizations based on your business focus (e.g., product line, region, team)
#Business Value
Identify collection bottlenecks
Visualize credit risks & recovery trends
Understand half-year growth trajectory
Whether you require a straightforward breakdown or a deep-dive financial analysis, this report will empower you to monitor receivables, track default risks, and optimize your cash flow strategy.
#Scope of Work
Entry and processing of up to 1,000 rows of data
Comparative analysis: Sales vs. Credit Collection
Aging report to identify overdue invoices
Dynamic charts & visuals for at-a-glance insights
Tailored KPIs relevant to your industry
Exportable Excel file + optional Google Sheets version
#Deliverables
A clean, professional Excel file with charts
Summary of key findings and recommendations
Customizations based on your business focus (e.g., product line, region, team)
#Business Value
Identify collection bottlenecks
Visualize credit risks & recovery trends
Understand half-year growth trajectory
Purpose
BusinessIndustry
Retail & WholesaleLanguage
EnglishWhat's included
| Service Tiers |
Starter
$40
|
Standard
$60
|
Advanced
$80
|
|---|---|---|---|
| Delivery Time | 2 days | 3 days | 4 days |
Number of Revisions | 1 | 2 | 3 |
Number of Hours of Work | 5 | 10 | 15 |
Basic Photo Editing | - | - | |
Organize & Classify/Tag Files | - | ||
Formatting & Clean Up | |||
Project Management Support | - | ||
Travel Planning | - | - |
Optional add-ons
You can add these on the next page.
Fast Delivery
+$10 - $30
Additional Revision
+$5
Additional Hour of Work
+$3
Basic Photo Editing
(+ 2 Days)
+$1
Organize & Classify/Tag Files
(+ 1 Day)
+$1
Project Management Support
(+ 1 Day)
+$5
Travel Planning
(+ 1 Day)
+$5Frequently asked questions
About MD Nurul Anuwer
Excel Expert | Dashboards, Data Analysis, Automation & Reporting
Chattogram, Bangladesh - 1:09 pm local time
✅ Built automated dashboards for cross-functional sales teams
✅ Cleaned & transformed datasets of 10K+ rows using advanced Excel formulas
✅ Delivered CRM insights that improved decision-making for C-level executives
I support clients by streamlining data workflows, improving accuracy, and visualizing key business metrics through powerful Excel solutions.
🔍 Services Offered:
Dynamic Excel dashboards with slicers, graphs, KPIs
Data cleaning, transformation, and formatting
VBA automation and task macros
Sales performance and reporting sheets
CRM or e-commerce data import/export and analysis
📩 Let’s discuss how I can help bring clarity to your data.
Steps for completing your project
After purchasing the project, send requirements so MD Nurul Anuwer can start the project.
Delivery time starts when MD Nurul Anuwer receives requirements from you.
MD Nurul Anuwer works on your project following the steps below.
Revisions may occur after the delivery date.
Initial Data Review
I'll begin by reviewing the data you've provided, ensuring it is accurate, complete, and formatted correctly for analysis.
Data Entry & Processing
I'll enter the data into the appropriate software (Excel, Google Sheets, etc.), organizing it for analysis. This includes cleaning up any inconsistencies or errors in the data.