You will get KPI Dashboard for Tracking Operational Performance

Project details
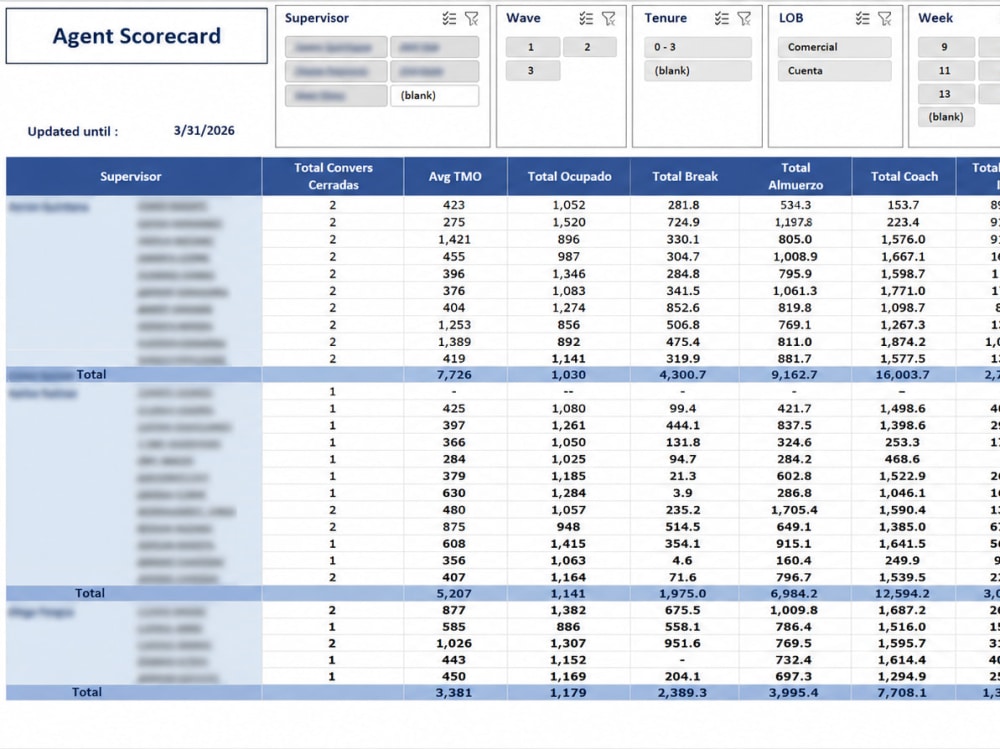
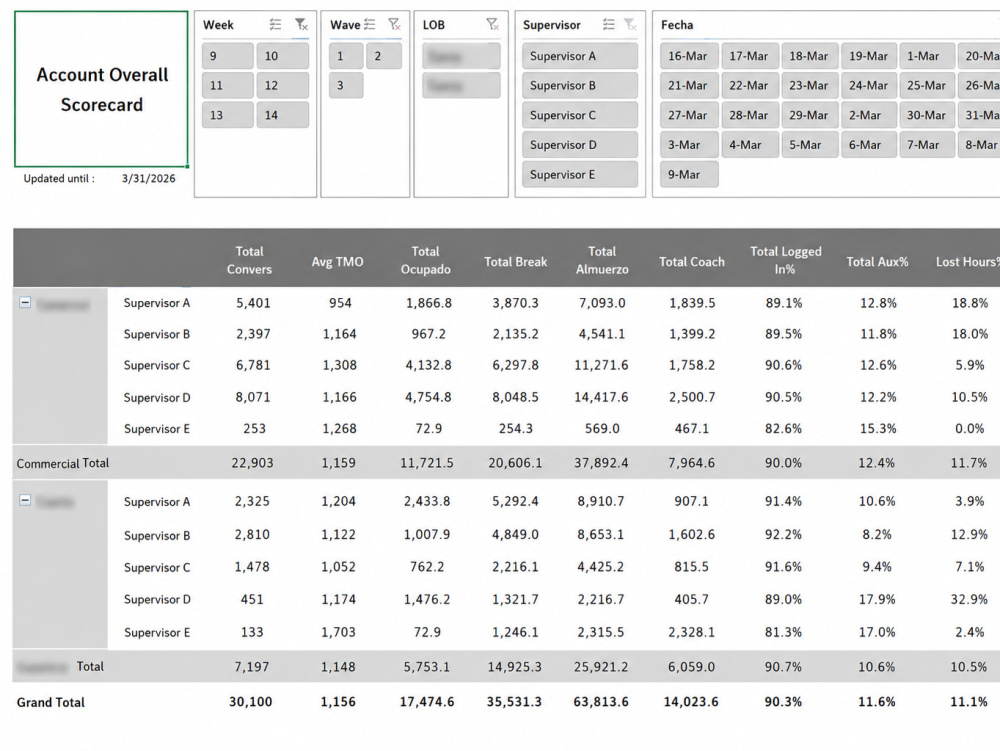
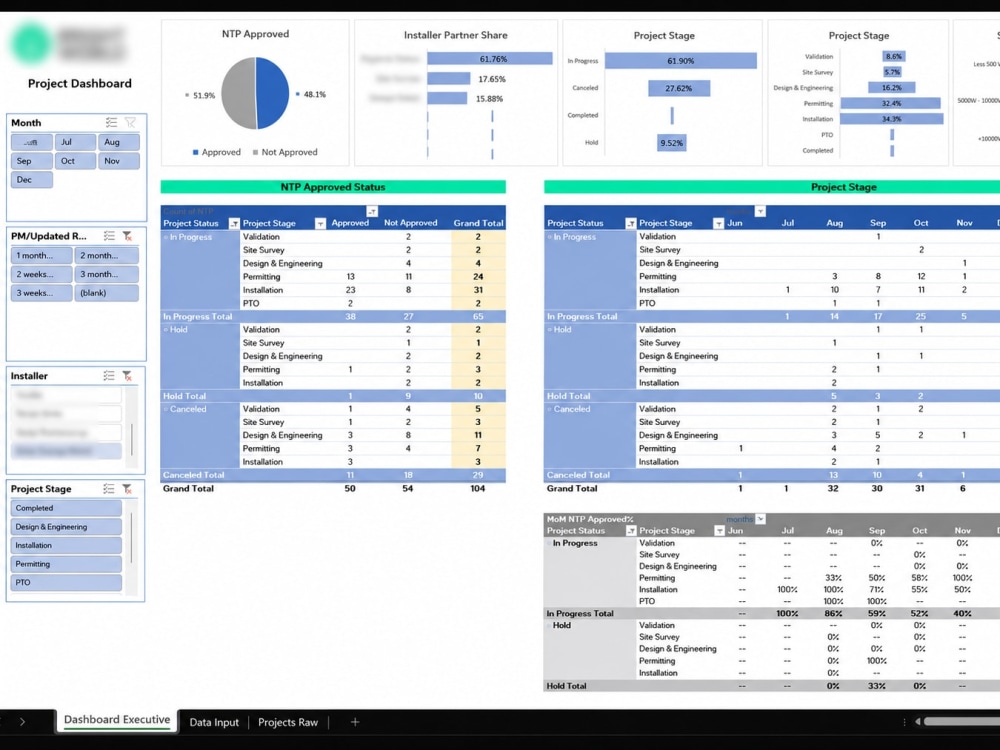
I will create a professional Excel KPI Dashboard that transforms your raw data into clear, actionable insights to support better business decisions.
With 15+ years of experience in operations management, workforce management, and performance analysis, I understand that a dashboard is not only about presenting numbers—it is about helping you identify trends, measure performance, and understand what actions should be taken.
This project includes data organization, KPI calculations, professional formatting, and dashboard creation using Excel tools such as Pivot Tables, formulas, charts, and interactive reporting elements.
You will receive a structured Excel solution designed to help you:
• Monitor key performance indicators
• Identify trends and performance gaps
• Improve reporting visibility
• Make data-driven decisions
I focus on creating dashboards that are practical, easy to understand, and aligned with your business objectives.
With 15+ years of experience in operations management, workforce management, and performance analysis, I understand that a dashboard is not only about presenting numbers—it is about helping you identify trends, measure performance, and understand what actions should be taken.
This project includes data organization, KPI calculations, professional formatting, and dashboard creation using Excel tools such as Pivot Tables, formulas, charts, and interactive reporting elements.
You will receive a structured Excel solution designed to help you:
• Monitor key performance indicators
• Identify trends and performance gaps
• Improve reporting visibility
• Make data-driven decisions
I focus on creating dashboards that are practical, easy to understand, and aligned with your business objectives.
Data Entry Type
Copy Paste, Data Cleansing, Error Detection, Word ProcessingData Entry Tool
Microsoft Excel, Microsoft OfficeWhat's included
| Service Tiers |
Starter
$75
|
Standard
$150
|
Advanced
$300
|
|---|---|---|---|
| Delivery Time | 3 days | 5 days | 7 days |
Number of Revisions | 1 | 2 | 3 |
Number of Hours of Work | 3 | 6 | 10 |
Formatting & Clean Up | |||
Graph & Table Creation |
Frequently asked questions
About Alberto
Excel Data Analyst | Dashboards | KPI Reporting | Process Improvement
Lourdes, El Salvador - 6:17 pm local time
With 15+ years of experience in operations management, workforce management, and data-driven decision-making, I combine strong Excel skills with real business understanding. My goal is not only to organize data, but to help you understand what the numbers mean and how they can support better decisions.
My expertise includes:
• Excel reporting and dashboard creation
• Data cleaning, formatting, and analysis
• KPI tracking and performance reports
• Pivot tables, formulas, and spreadsheet improvements
• Operational data analysis and process improvement
• Workforce management analytics (forecasting, staffing analysis, scheduling insights)
• Transforming complex datasets into clear, executive-friendly reports
Throughout my career, I have worked with large operational teams where accurate reporting, capacity planning, and performance analysis were critical for decision-making. This experience allows me to approach Excel projects from both a technical and business perspective.
I can help you with:
✓ Building professional Excel dashboards
✓ Improving and optimizing existing spreadsheets
✓ Creating clear and structured reports
✓ Analyzing trends and identifying opportunities
✓ Turning disconnected data into meaningful insights
If you need someone who understands both the numbers and the business decisions behind them, I would be happy to support your project.
Steps for completing your project
After purchasing the project, send requirements so Alberto can start the project.
Delivery time starts when Alberto receives requirements from you.
Alberto works on your project following the steps below.
Revisions may occur after the delivery date.
Review Data and Requirements
Analyze the provided data, understand business objectives, and identify the required KPIs and dashboard structure.
Clean and Organize Data
Format, structure, and prepare the data to ensure accuracy and create a reliable reporting foundation.