You will get Using Power Query in Excel to clean up messy data,
Project details
I am using the Power Query project stand out, emphasize these key aspects:
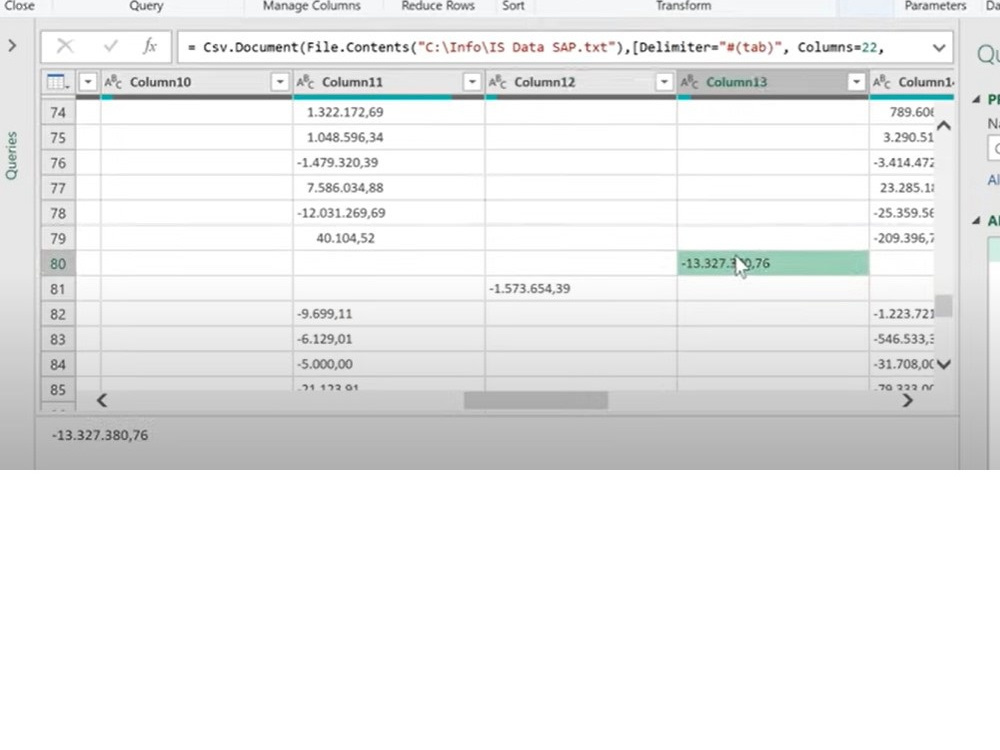
Unique Data Sources: Highlight if you're connecting to various data sources, such as Excel tables, CSV files, databases, and even web pages. Consolidating and analyzing data from multiple sources demonstrates a valuable skill.
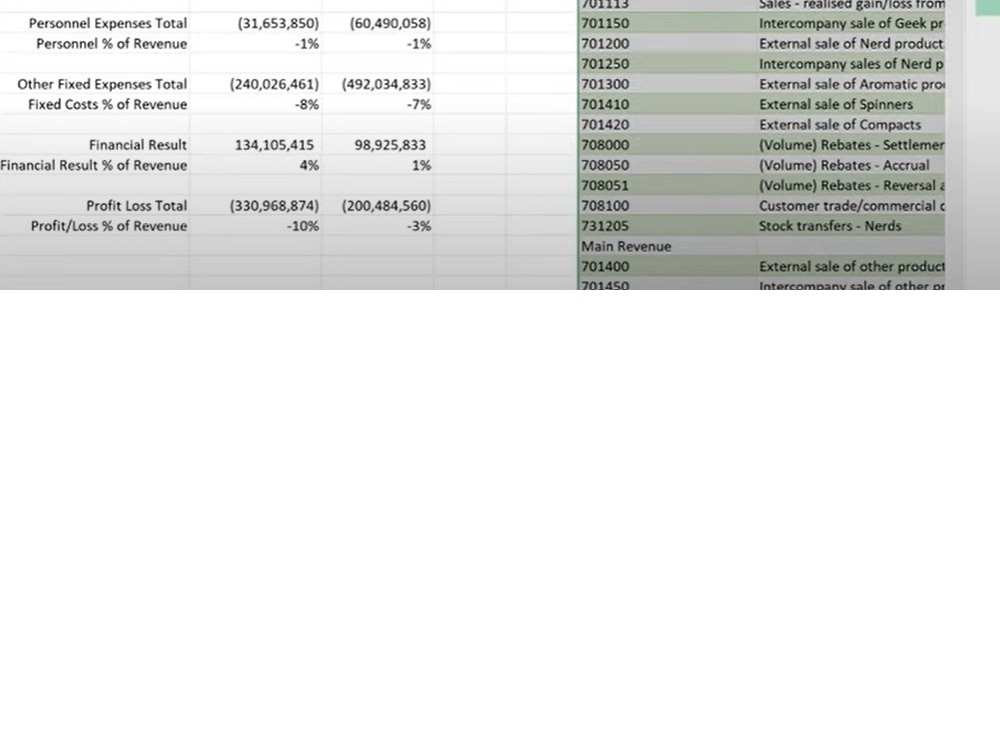
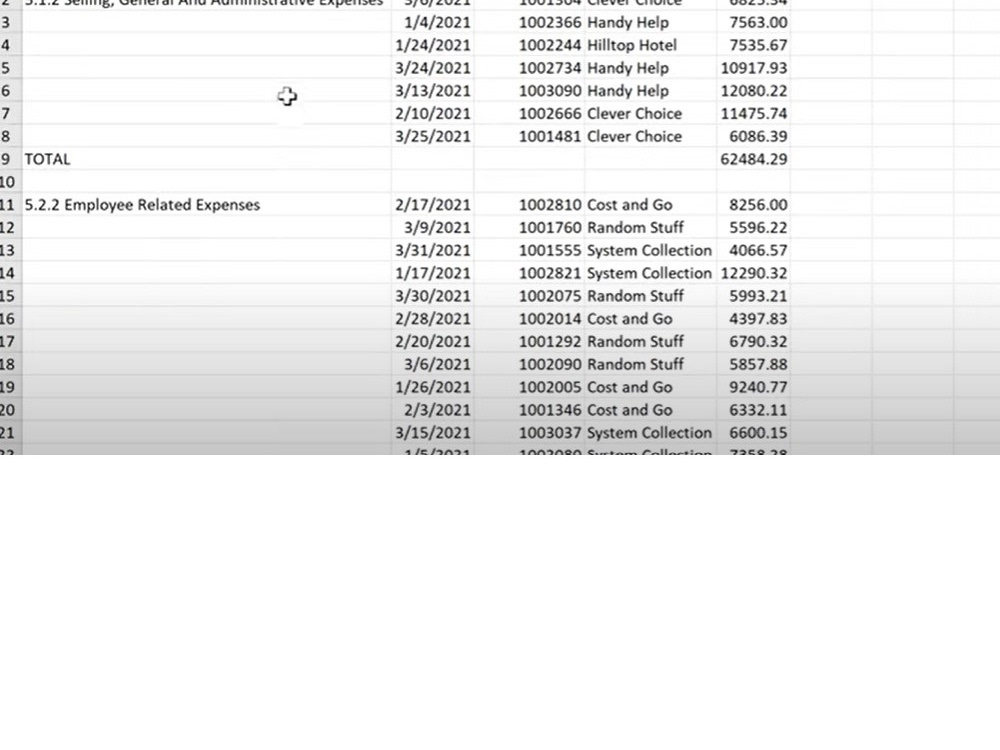
Complex Transformations: Showcase any intricate calculations or data manipulations you've performed. Power Query excels at complex transformations, so make sure to detail those.
Impact and Efficiency: Explain how your project improves efficiency by automating data cleaning tasks. Quantify the time saved or resources optimized.
Data Profiling: Mention if you have analyzed the quality, structure, and content of data. This includes identifying data types, detecting data distribution, identifying missing values or outliers, and assessing data quality.
Here are some project I have been participating in :-
Sales Performance Dashboard for E-commerce: Track sales, revenue, and customer demographics.
Human Resource Analytics Dashboard: Provide insights into employee demographics, turnover rates, and performance metrics.
Unique Data Sources: Highlight if you're connecting to various data sources, such as Excel tables, CSV files, databases, and even web pages. Consolidating and analyzing data from multiple sources demonstrates a valuable skill.
Complex Transformations: Showcase any intricate calculations or data manipulations you've performed. Power Query excels at complex transformations, so make sure to detail those.
Impact and Efficiency: Explain how your project improves efficiency by automating data cleaning tasks. Quantify the time saved or resources optimized.
Data Profiling: Mention if you have analyzed the quality, structure, and content of data. This includes identifying data types, detecting data distribution, identifying missing values or outliers, and assessing data quality.
Here are some project I have been participating in :-
Sales Performance Dashboard for E-commerce: Track sales, revenue, and customer demographics.
Human Resource Analytics Dashboard: Provide insights into employee demographics, turnover rates, and performance metrics.
Data Entry Type
Copy Paste, Data CleansingData Entry Tool
Google Sheets, Microsoft Excel, Microsoft OfficeWhat's included $100
These options are included with the project scope.
$100
- Delivery Time 10 days
- Number of Revisions 2
- Number of Hours of Work 20
- Formatting & Clean Up
- Graph & Table Creation
About Islam
Planning& Scheduling/Primavera/Excel/Power BI expert/Data analyst
Alexandria, Egypt - 4:05 pm local time
Steps for completing your project
After purchasing the project, send requirements so Islam can start the project.
Delivery time starts when Islam receives requirements from you.
Islam works on your project following the steps below.
Revisions may occur after the delivery date.
Finishing 50% of the work
Finishing 100% of the work