You will get Fix and Audit of your Power BI Excel or Looker Studio Dashboard
Project details
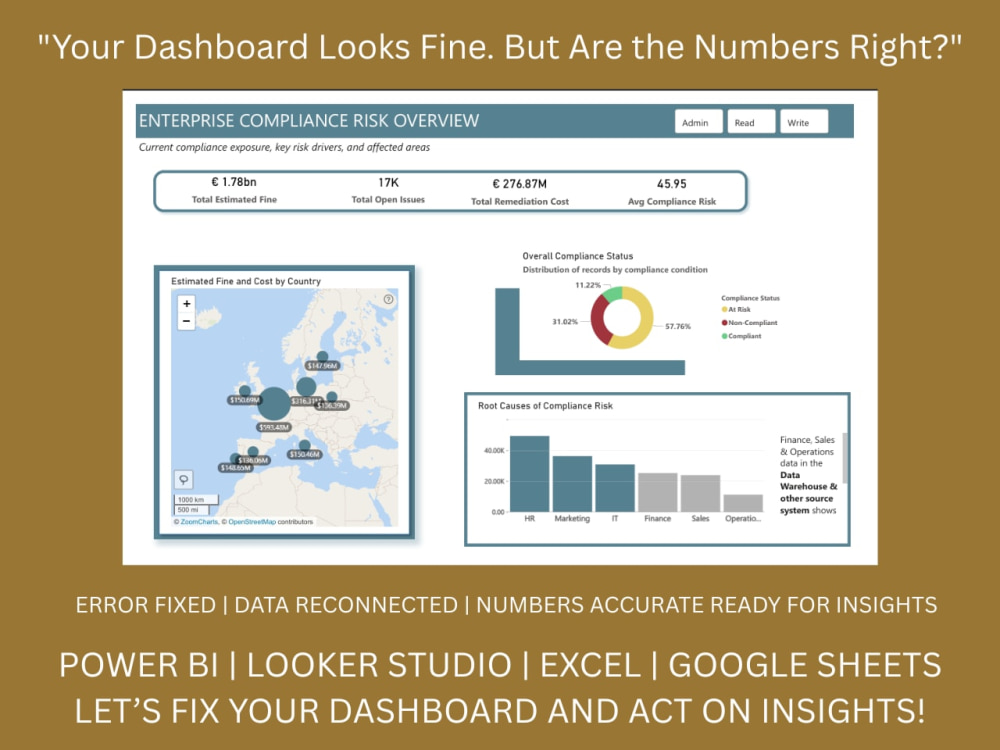
Whether your dashboard is built in Power BI, Looker Studio, Excel or Google Sheets — if the numbers are wrong or the structure is broken, the problem rarely sits where it looks like it does.
Most dashboard errors trace back to one of three things: a broken DAX or formula measure, a disconnected data source, or a model built before the actual business questions were clear. In past audits this is where the wrong numbers were almost always coming from, not from the visuals themselves.
You walk away knowing exactly what was broken, why it was producing wrong numbers and either a fully fixed version or a clean rebuild that works the way it was supposed to from the start.
Every audit includes a written report of what was found, what was wrong at the root and exactly what was changed. Not just a fixed file. A complete record of what your dashboard actually needed and why.
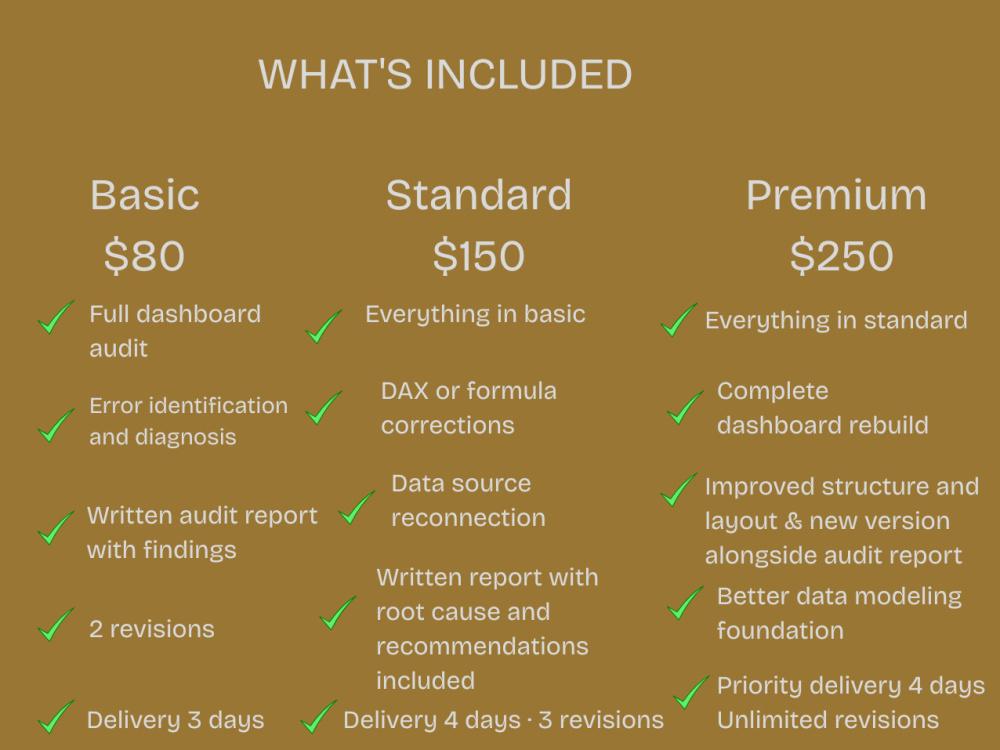
What's included
| Service Tiers |
Starter
$80
|
Standard
$150
|
Advanced
$250
|
|---|---|---|---|
| Delivery Time | 3 days | 4 days | 4 days |
Number of Revisions | 2 | 3 | Unlimited |
Number of Graphs/Charts | 8 | 10 | 20 |
Number of Variations | 1 | 1 | 1 |
Data Source Connectivity | |||
Web Embedding | - | - | - |
Interactive/Animated Visuals | - | - | - |
Optional add-ons
You can add these on the next page.
Fast Delivery
+$10 - $30
Additional Revision
+$10
Additional Graph/Chart
+$5
Detailed Report
(+ 1 Day)
+$10About Muskan
Power BI & Looker Studio Analyst | Dashboard & Insight Report | Excel
Mumbai, India - 2:57 am local time
I work with e-commerce, Shopify, retail and B2B sales businesses to find what the data is actually saying — the revenue leakage, pricing gaps and campaign blind spots that dashboards show but never explain.
The problem I see most often is one of two things. Either the data is messy and nobody trusts it. Or the dashboard was built without being connected to the actual decision that needed to be made. Both cost real money and both are fixable.
Every project comes with a written insight report alongside the dashboard so you leave with a complete answer not just a visual.
📌 Recent results
Retail · Pricing Analysis · Power BI
Found a potential $491K revenue loss a retail business did not know existed. A 5% smartphone discount was running with zero measurable impact on demand while old stock laptops were quietly outperforming every other category. Built a Power BI dashboard covering every product line and discount pattern. The business walked away with a clear pricing strategy and knew exactly where margin was being lost.
Marketing Analytics · Looker Studio · Campaign Performance
Turned 2,000 plus campaigns across 15.4 million emails into an actionable revenue strategy. A marketing team had no visibility into which campaigns were actually driving revenue. Built a multi source Looker Studio dashboard connected to Google Sheets breaking down performance by industry, timing and campaign type. Found Healthcare and Finance drove $8K to $10K in revenue, personalized emails converted 2x better and Wednesday morning was the highest performing send window.
💡 Who I work with
If you are in any of these situations the answer is already in your data:
You run a Shopify or e-commerce business and your campaign data, store revenue and customer behavior all live in separate places. You are making budget decisions completely blind.
You are in retail or B2B sales and something is underperforming but you cannot pinpoint where. I have found pricing gaps, discount inefficiencies and revenue leakage that businesses had no idea existed.
You run a marketing team and still cannot tell which campaigns are actually driving revenue. Every decision is based on incomplete information.
⚡ What I build
✅Power BI — KPI dashboards, DAX, Power Query, data modeling for sales, retail and finance
✅Looker Studio — multi source dashboards for marketing, e-commerce, GA4 and Shopify reporting
✅Excel and Google Sheets — dashboards, Shopify reports and automated reporting for small businesses
✅SQL — data cleaning, transformation and aggregation before anything gets visualized
✅GA4 and Google Analytics — traffic analysis, funnel analysis and customer behavior reporting
✅Written Insight Report — every project includes root cause, key findings and clear recommendations. Not just a dashboard. A complete answer.
⭐ What clients say
"The dashboards were clean, well structured and visually impressive. The ability to turn raw data into meaningful insights is really commendable."
Sayyad I. · Verified · March 2026
"The Power BI dashboard was clear and easy to use. Her data storytelling makes the insights stand out. Reliable and knows how to handle data projects."
Arafah L. · Verified · March 2026
Every project starts with a scoping call. I need to understand your problem, your tool and the decision you are actually trying to make before I build anything. Nothing gets built on assumptions.
📩 Message me and tell me what you are trying to figure out. We will go from there.
Steps for completing your project
After purchasing the project, send requirements so Muskan can start the project.
Delivery time starts when Muskan receives requirements from you.
Muskan works on your project following the steps below.
Revisions may occur after the delivery date.
INTAKE AND REVIEW
DATA SOURCE AUDIT