You will get A clear Power BI dashboard that turns your data into smart decisions
Project details
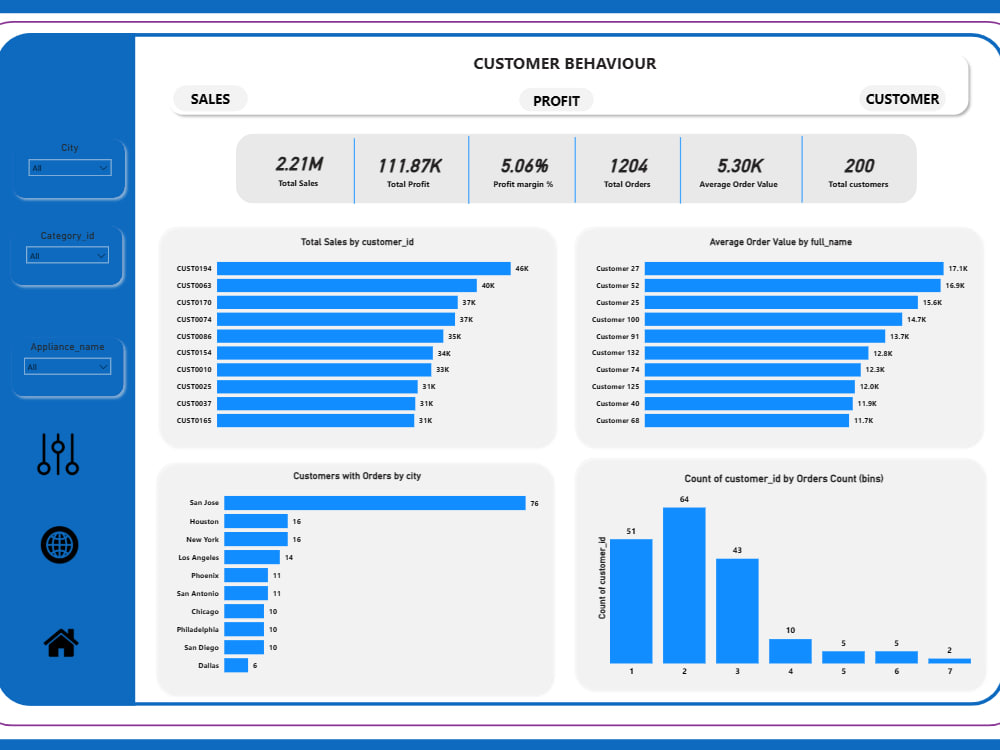
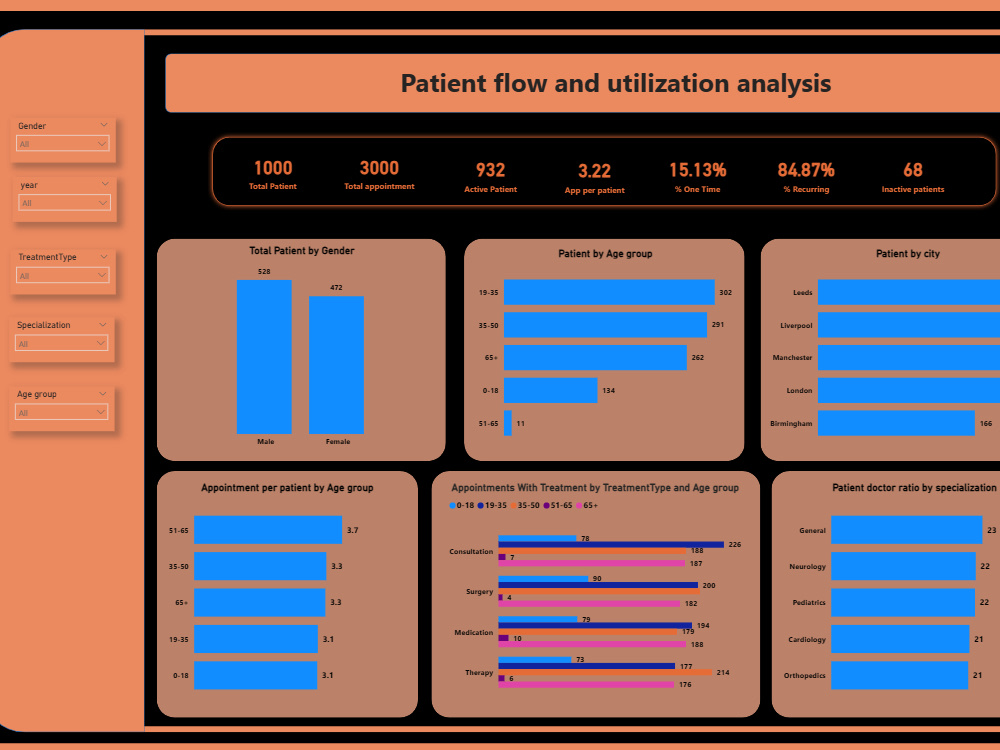
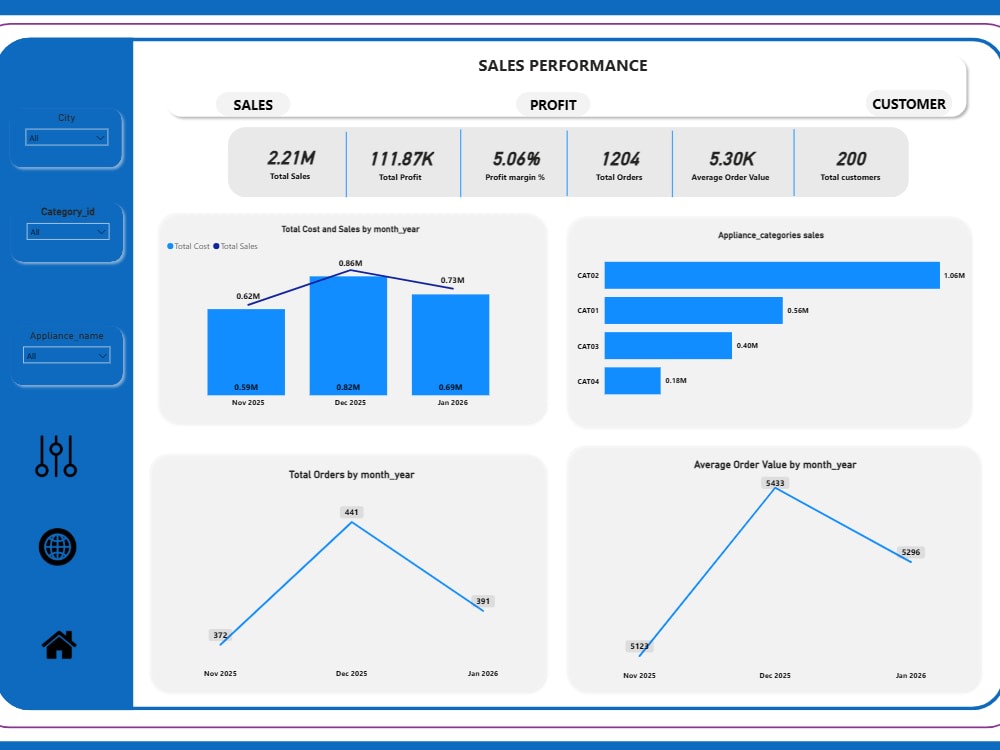
Unlike generic dashboards that simply display numbers, I build fully interactive Power BI reports with custom DAX formulas and calculations that deliver accurate, real-time business metrics tailored specifically to your data. Every dashboard is designed with clean visuals and intuitive layout so both technical and non-technical stakeholders can understand and act on the insights immediately. I connect your Excel or CSV data, model it properly and deliver a professional report that supports smarter business decisions from day one.
Database Type
MySQLWhat's included
| Service Tiers |
Starter
$80
|
Standard
$120
|
Advanced
$180
|
|---|---|---|---|
| Delivery Time | 2 days | 3 days | 5 days |
Number of Revisions | 1 | 2 | 3 |
Source Code | - | - | - |
Frequently asked questions
About Vivian
Data Analyst | End-to-End Analytics | Power BI | SQL | Python | Excel
Port Harcourt, Nigeria - 3:00 am local time
I work across the full data pipeline: from extracting and cleaning data, to modelling and building interactive dashboards that give decision-makers the visibility they need.
WHAT I BRING TO YOUR PROJECT
✦ Data Cleaning & Preparation — Python (Pandas), Power Query, Excel
✦ Database Design & SQL Analysis — SQL Server, Star & Snowflake Schema
✦ Dashboard & Visualisation — Power BI, Tableau, interactive KPI reporting
✦ Automation & Efficiency — Excel VBA macros, automated workflows
✦ API Data Extraction — Python (requests, REST APIs), JSON parsing
✦ Statistical Analysis — Descriptive statistics, RFM segmentation, correlation
✦ Business Intelligence — KPI tracking, executive-level reporting
✦ CRM- Hubspot, Zendesk, Freshdesh, Zoho, Salesforce
📊 Invoice Reconciliation Automation (Excel + VBA)
Built an automated reconciliation system processing 500+ transactions using Excel VBA macros and advanced formulas (INDEX/MATCH, XLOOKUP). Reduced manual reconciliation time from 3 hours to 5 minutes — a 96% time saving — while eliminating 95% of matching errors. Delivered an interactive dashboard with real-time KPIs and automated exception reporting.
🛒 Brazilian E-Commerce Analytics (Python + Power BI)
End-to-end analysis of the Olist e-commerce dataset — cleaning 941,910+ rows in Python, enforcing referential integrity across 6 relational tables, and building a Snowflake schema data model in Power BI. Delivered insights across revenue trends, geographic sales distribution, delivery efficiency, product performance, and customer satisfaction.
🏪 E-Commerce Data Warehouse (SQL Server + Power BI)
Designed a full SQL Server data warehouse using Star Schema architecture. Implemented primary/foreign keys, CHECK constraints, UNIQUE constraints, and email validation for data integrity. Built reporting views and an interactive Power BI dashboard analysing sales performance, product profitability, and customer purchasing behaviour.
👥 RFM Customer Segmentation (Excel Power Query + Python)
Analysed 941,910 rows of retail transactional data, cleaning and validating down to 392,733 records. Applied RFM (Recency, Frequency, Monetary) scoring on a 1–10 scale to segment customers into behavioural groups. Conducted Pareto (80/20) analysis to identify revenue concentration and delivered targeted marketing strategy recommendations per segment.
🎧 CRM & Support Operations Analysis (Freshdesk + Excel)
Configured a Freshdesk account as admin — setting up agent roles, skill-based routing, escalation rules, SLA policies, and a self-service knowledge base. Created and managed 100+ test tickets across channels, then exported and analysed the data in Excel: tracking ticket status distribution, first response times, resolution times, and agent performance. This project reflects my understanding of how CRM configurations directly shape the data you can analyse downstream.
WHY WORK WITH
I don't just clean data — I build analytical structures that support reliable, long-term business decision-making. I combine technical precision with business context, ensuring every project delivers not just numbers, but actionable intelligence.
I communicate clearly, meet deadlines, and take full ownership of every project from start to finish. Whether you need a one-time analysis, an automated reporting system, or a full BI dashboard — I am ready to deliver.
Let's turn your data into your most valuable business asset.
Send me a message — I'd love to learn about your project.
Steps for completing your project
After purchasing the project, send requirements so Vivian can start the project.
Delivery time starts when Vivian receives requirements from you.
Vivian works on your project following the steps below.
Revisions may occur after the delivery date.
Receive and review client data and requirements Description
Download and carefully review the client's Excel or CSV file and all dashboard requirements to fully understand the scope before starting
Assess and explore the data Description
Examine the dataset structure, check for quality issues and identify the key fields needed to build accurate visuals and calculations.