You will get a data analyst in data visualization.
Project details
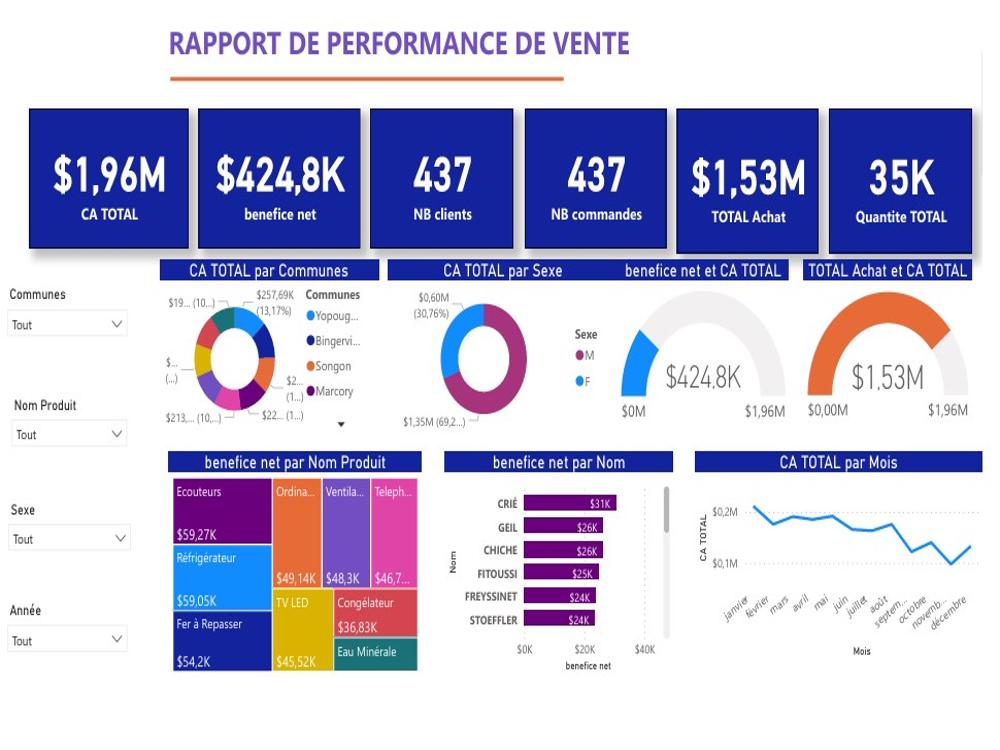
What sets me apart is my ability to transform raw data into clear and compelling visual stories. I don't just create simple graphs: I design interactive and strategic dashboards that highlight the real drivers of decision-making. Thanks to my mastery of Excel, Power BI, and Python, I combine analytical rigor with a sense of design to deliver solutions that are accurate, intuitive, and tailored to the specific needs of each client.
Database Type
MySQL, MS SQL, MS Access, SQLiteWhat's included
| Service Tiers |
Starter
$5
|
Standard
$10
|
Advanced
$15
|
|---|---|---|---|
| Delivery Time | 3 days | 2 days | 1 day |
Number of Revisions | 1 | 2 | 3 |
Source Code | - | - | - |
About Kouadio Serge Pacome
Expert Data Analyst
Abidjan, Cote d'Ivoire - 8:22 am local time
I then visualize them in attractive and informative graphic forms (tables, graphs, maps, etc.). This makes complex information more accessible to stakeholders. He often uses tools such as :
- dashboards with tools like Power BI, Tableau or Google Data.
Steps for completing your project
After purchasing the project, send requirements so Kouadio Serge Pacome can start the project.
Delivery time starts when Kouadio Serge Pacome receives requirements from you.
Kouadio Serge Pacome works on your project following the steps below.
Revisions may occur after the delivery date.
objectives Data collection