You will get a fully cleaned structured Excel file with pivot analysis and dashboard
Rising Talent
Project details
I will clean, analyse and visualise your Excel data
so it is ready to use for reporting and decision making.
What I deliver:
• Duplicate removal and blank handling
• Date and format standardisation
• Calculated columns (margins, growth, ratios)
• Pivot tables by category, time period or segment
• Advanced formulas: XLOOKUP, INDEX MATCH, SUMIFS, IF
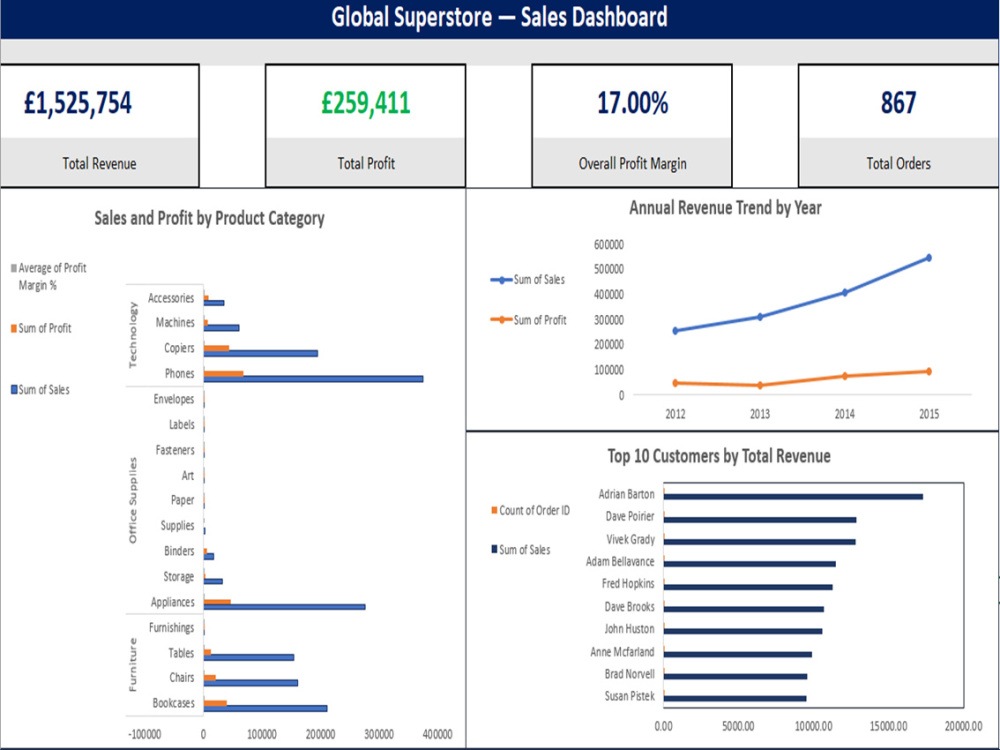
• KPI dashboard with revenue, profit and trend charts
I have built a full end-to-end Excel project on the
Global Superstore dataset (1,000+ rows) covering all
of the above — see my portfolio for the full example.
GitHub: github.com/sahpalsingh3-dot/excel-data-analysis-global-superstore
If you are not sure what you need, message me first
and I will advise.
so it is ready to use for reporting and decision making.
What I deliver:
• Duplicate removal and blank handling
• Date and format standardisation
• Calculated columns (margins, growth, ratios)
• Pivot tables by category, time period or segment
• Advanced formulas: XLOOKUP, INDEX MATCH, SUMIFS, IF
• KPI dashboard with revenue, profit and trend charts
I have built a full end-to-end Excel project on the
Global Superstore dataset (1,000+ rows) covering all
of the above — see my portfolio for the full example.
GitHub: github.com/sahpalsingh3-dot/excel-data-analysis-global-superstore
If you are not sure what you need, message me first
and I will advise.
Data Tool
Microsoft ExcelWhat's included
| Service Tiers |
Starter
$50
|
Standard
$100
|
Advanced
$175
|
|---|---|---|---|
| Delivery Time | 2 days | 3 days | 4 days |
Number of Revisions | 1 | 2 | 3 |
About Sahpal
Data Analyst and Power BI Developer - SQL, Python, Excel, MSc Maths
Glasgow, United Kingdom - 10:23 pm local time
I am a UK-based data analyst with an MSc in Applied Mathematics from the University of Dundee. I build end-to-end reporting solutions — from cleaning raw data with Python (Pandas) through SQL database queries to interactive Power BI dashboards with DAX measures and KPI tracking.
What I can deliver for you:
▸ Power BI dashboards — data modelling, DAX, time intelligence (YTD, MoM), KPI cards, interactive slicers
▸ SQL reports — joins, CTEs, RANK(), LAG(), GROUP BY, clean data extraction
▸ Excel workbooks — pivot tables, XLOOKUP, data cleaning, automated KPI reports
▸ Python data cleaning — Pandas, combining multiple files, EDA with Matplotlib and Seaborn
I have built real projects including a regional sales performance dashboard tracking £1.49M revenue across regions, both documented on GitHub.
I deliver clean, well-documented work on time with clear communication throughout. If you have a data problem you need solving, send me a message and I will tell you exactly how I would approach it.
Steps for completing your project
After purchasing the project, send requirements so Sahpal can start the project.
Delivery time starts when Sahpal receives requirements from you.
Sahpal works on your project following the steps below.
Revisions may occur after the delivery date.
Review and assess your data
I review your file, check for duplicates, blanks, formatting issues and confirm the scope before starting
Clean and prepare the data
Remove duplicates, fix blanks, standardise dates and formats, add calculated columns where needed