Sergey isn't taking new orders for this project right now. Here are some similar projects to explore.
You will get a Google map or Mapbox(Leafelt) map connected to your spreadsheet or CSV
Top Rated

Project details
You will get an interactive map.
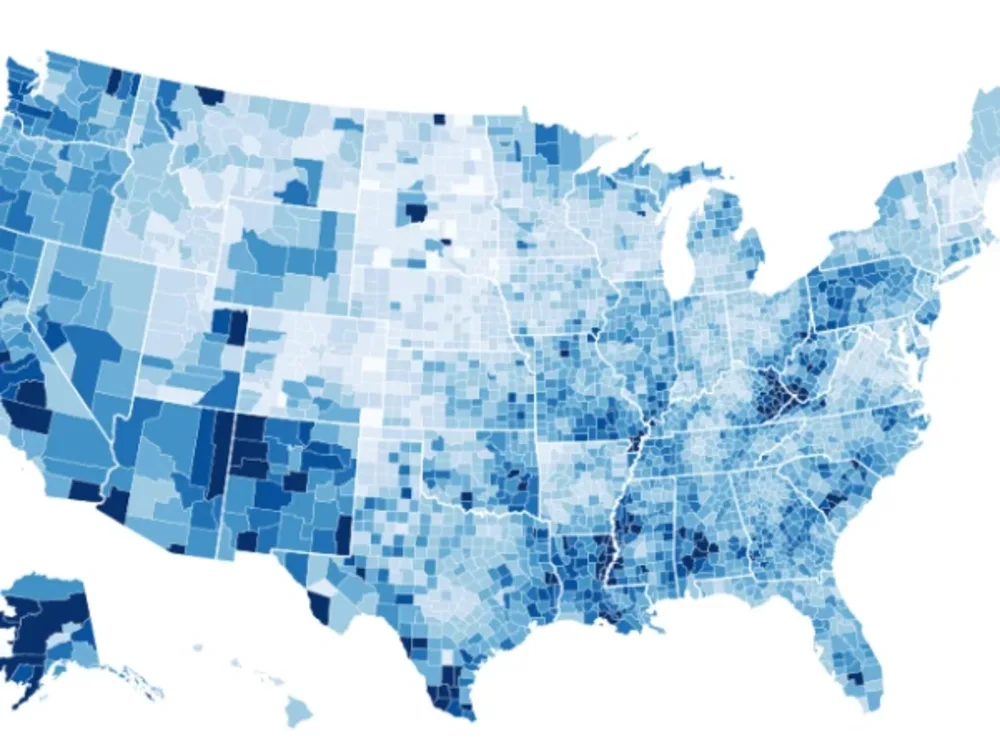
Choropleth or Heat Maps
These maps use world map coloring or patterns to display numerical data for specific areas or regions. Choropleth maps can display population density, income, political boundaries, and other information.
Icon or Marker Maps
marker maps illustrate different topics by regions using relevant icons or dots. The icon (marker) size is directly proportional to your data. The higher the value, the bigger the icon.
Programming Languages
PHP, HTML & CSS, JavaScriptCoding Expertise
Performance Optimization, DesignWhat's included
| Service Tiers |
Starter
$100
|
Standard
$300
|
Advanced
$700
|
|---|---|---|---|
| Delivery Time | 2 days | 4 days | 6 days |
Number of Revisions | 1 | 1 | 1 |
Number of Pages | 1 | 1 | 1 |
Design Customization | - | ||
Content Upload | |||
Responsive Design | |||
Source Code |
354 reviews
(352)
(2)
(0)
(0)
(0)
UM
Uros M.
Apr 2, 2021
BM
Bridget M.
Mar 11, 2026
Washington Wild - Interactive Map Build
TC
Tom C.
Mar 11, 2026
Map Raster processing (clipping basemap into polygons)
Sergey is a GIS and geospatial wizard. We have used him multiple times for different technical geospatial programming (OSM api queries) and data processing tasks, and once the deliverable is clear he has always delivered. We do not hesitate to hire him for any such work.
RM
Richard M.
Oct 23, 2025
Assisting with Integration of Interactive Map into Website
The freelancer was great to work with, and I hope to work with them again. They are responsive, did excellent work, and completed assigned tasks in a timely fashion. Highly recommended.
MA
Manolis A.
Sep 30, 2025
Troubleshout Openlayers WFS request problem
JZ
Jase Z.
Jul 14, 2025
Map Support Development
About Sergey
Web Mapping Specialist | 400+ Projects | Mapbox, Google map, GIS, OSM
100%
Job Success
Lviv, Ukraine - 1:47 pm local time
400+ completed projects on Upwork.
What I deliver:
Interactive maps: Mapbox GL / MapLibre / Leaflet / Google Maps / OpenStreetMap—3D, clustering, custom styling, high performance at scale.
Data visualization: D3.js, deck.gl, three.js—charts, heatmaps, spatial dashboards that tell a clear story.
Geo features: geocoding, routing, isochrones, drawing tools, spatial analysis (Turf.js, OpenRouteService).
Full‑stack support when needed: React, JS, PHP/MySQL, API integrations, data scraping/ETL.
My process:
You share your use case, sample data, and must‑have interactions.
I propose scope, architecture, milestones, and timeline (clear definition of done).
You get frequent demos and measurable progress
Send me a link to your current map (or a reference), sample data/source, and key interactions—I'll reply with a concrete plan and estimate.
Steps for completing your project
After purchasing the project, send requirements so Sergey can start the project.
Delivery time starts when Sergey receives requirements from you.
Sergey works on your project following the steps below.
Revisions may occur after the delivery date.
Send me your data
I will review the data and put it on the map