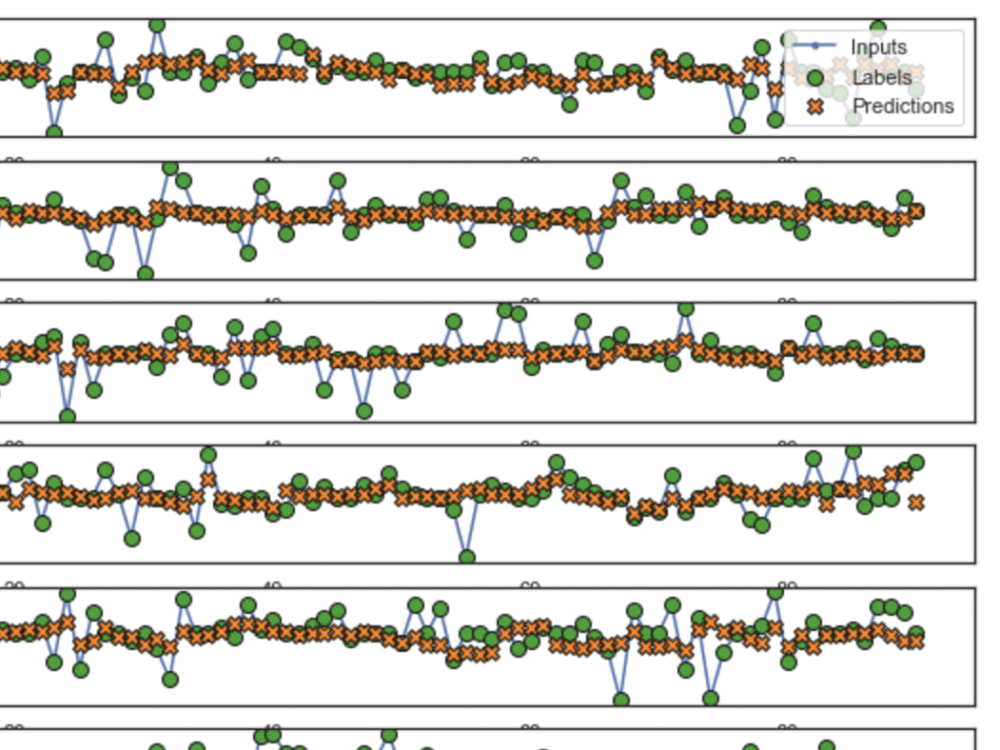
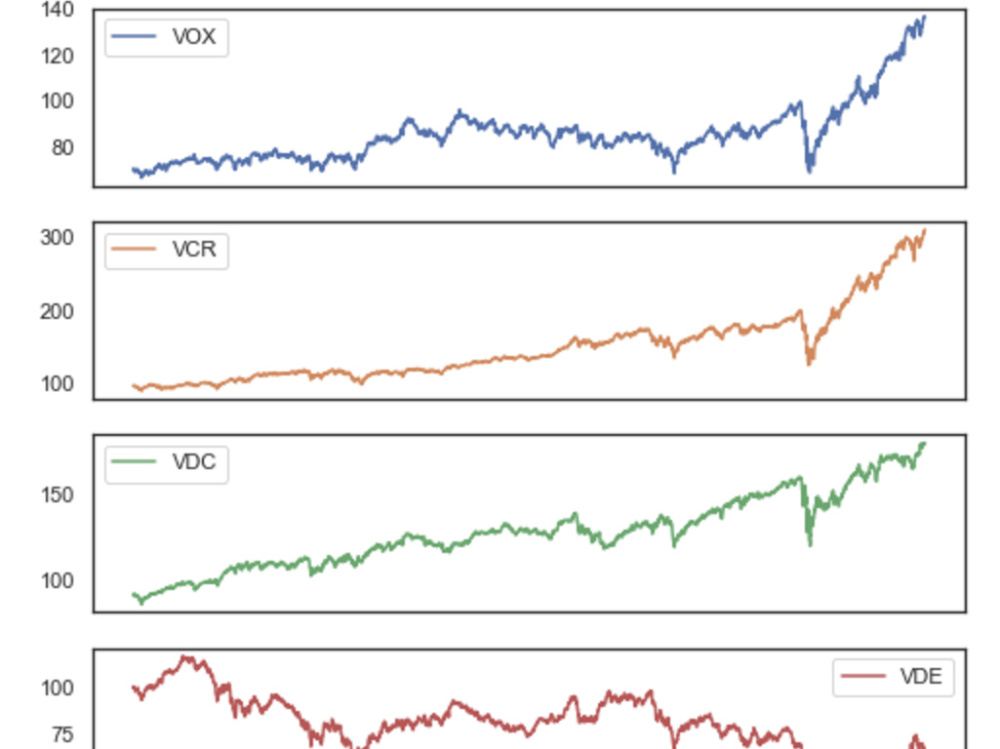
You will get a prediction on metrics for future N periods
Project details
You'll get 100% original metric prediction based on the requirements that you provided.
My methods include the following options:
### Time Series Models
• AR
• ARIMA
• SARIMA
• VAR
• Prophet
• LSTM
• DeepAR
### Visualization
• Plotly
• Matplotlib
• Seaborn
• Tableau
• Looker
• Google Sheet
The following prediction models/analytic methods are also available. Feel free to share your business context and questions with me, so that we can discuss how to use analytics to help your business grow.
### Other Prediction Models/Analytic Methods
• Time Series Models
• AWS Forecast
• Scikit-learn
• Statistics
• Regression
• Classification
• Xgboost
• Survival Analysis
• LTV
My methods include the following options:
### Time Series Models
• AR
• ARIMA
• SARIMA
• VAR
• Prophet
• LSTM
• DeepAR
### Visualization
• Plotly
• Matplotlib
• Seaborn
• Tableau
• Looker
• Google Sheet
The following prediction models/analytic methods are also available. Feel free to share your business context and questions with me, so that we can discuss how to use analytics to help your business grow.
### Other Prediction Models/Analytic Methods
• Time Series Models
• AWS Forecast
• Scikit-learn
• Statistics
• Regression
• Classification
• Xgboost
• Survival Analysis
• LTV
Machine Learning Tools
PythonWhat's included
| Service Tiers |
Starter
$139
|
Standard
$209
|
Advanced
$279
|
|---|---|---|---|
| Delivery Time | 3 days | 5 days | 7 days |
Number of Revisions | 1 | 1 | 1 |
Number of Scenarios | 0 | 0 | 0 |
Model Validation/Testing | |||
Model Documentation | |||
Data Source Connectivity | - | - | - |
Source Code | - | - | - |
Optional add-ons
You can add these on the next page.
Fast Delivery
+$50
Source Code
+$50About Yilin
8 yrs Full-time Exp. in Data Science | Visualization | Pipeline
Suzhou, China - 4:14 am local time
I provide the following primary services:
☑️ Load and extract data with BigQuery, DBT, Fivetran, Pandas, PostgreSQL, MySQL, Snowflake, AWS S3
☑️ Visualize trends for operations and decision-making with Tableau, Looker, Plotly, D3.js, QlikSense by leveraging topic analysis such as survival analysis, LTV, cohort analysis, funnel analysis etc.
☑️ Descriptive and predictive analytics with Python / Jupyter Notebook using Time Series Models, AWS Forecast, Scikit-learn, Statistics, Regression, Classification, Xgboost
☑️ Facilitate data workflow with Git, JIRA, Jenkins, Airflow, Boto3, Tableau API
During my journey in the data analytics field, I'm always motivated by navigating through messy data to find patterns and delivering on time to fulfill stakeholders' requirements.
Current location: China
Steps for completing your project
After purchasing the project, send requirements so Yilin can start the project.
Delivery time starts when Yilin receives requirements from you.
Yilin works on your project following the steps below.
Revisions may occur after the delivery date.
Share timeline estimation with client
Discuss clarification questions with client, if there is any question